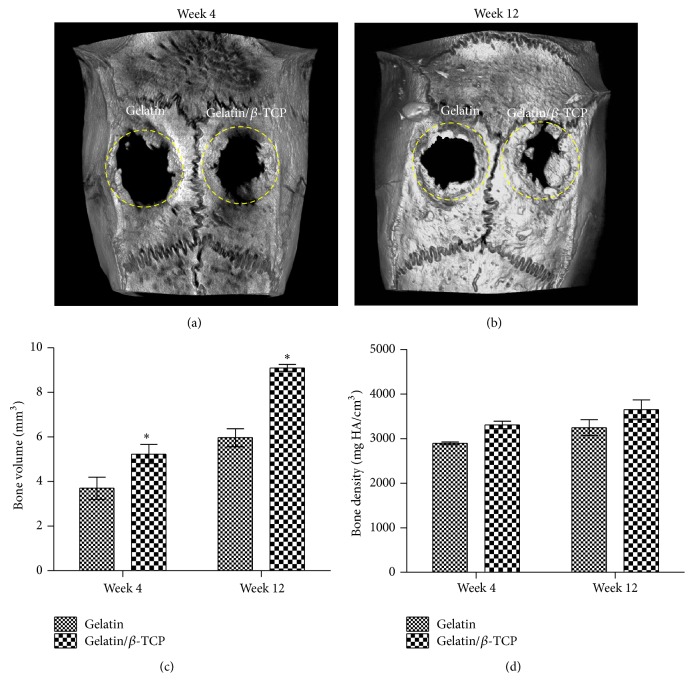
Figure 7.
Micro-CT analysis of rat calvarial defects repair. ((a) and (b)) Representative 3D µ-CT images of rat calvarial defects at 4 weeks (a) and 12 weeks (b) after implantation. ((c) and (d)) The quantitative analysis of the bone volume and bone density at 4 weeks (c) and 12 weeks (d) after implantation. Dashed circles denote the bone defect regions. (* P < 0.05).

