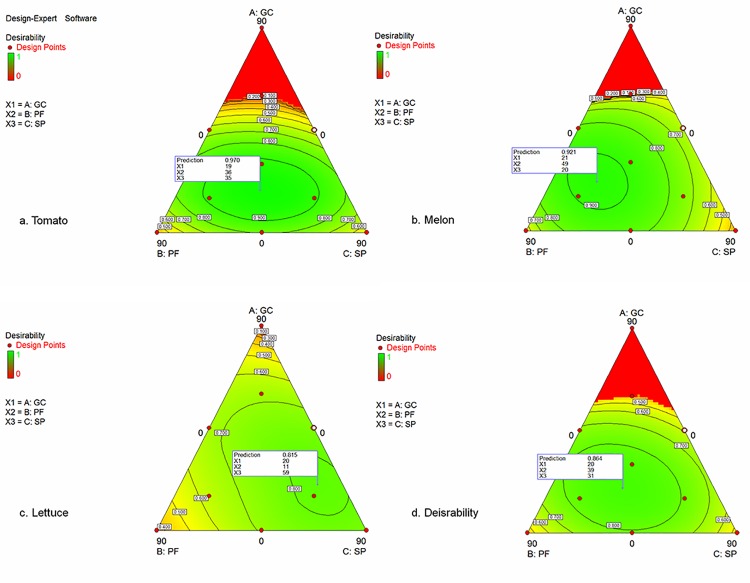
Fig 2. Desirability functions considering the substrates elaborated for the vegetal species (a—c) and for all the vegetal species studied (d).
The flag reports the highest prediction level of the optimal transplants performance and the corresponding proportions of each component. Green colour in the surface represents the area in which the optimal transplants characteristics are obtained. (a) Tomato. (b) Melon. (c) Lettuce. (d) All the vegetal species studied.

