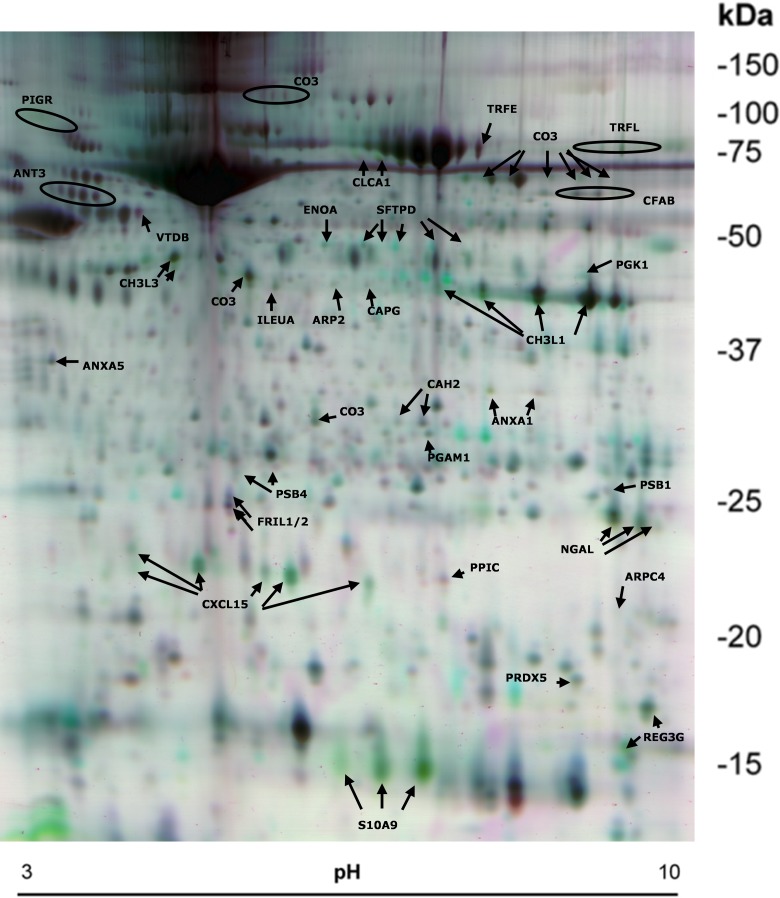
Fig 3. False color 2D-DIGE image of BALF protein spots.
WT BALB/c, CD1d-/- and Jα18-/- mice were exposed to α-GalCer or to a vehicle and their BALFs were used for 2D-DIGE. In the shown gel pair, purple spots represent decreased abundance and green spots represent increased protein abundance in the α-GalCer—treated WT samples as compared to vehicle-treated WT samples. Protein spots identified with LC-MS/MS are labelled with their UniProt entry name and are listed in Table 1.

