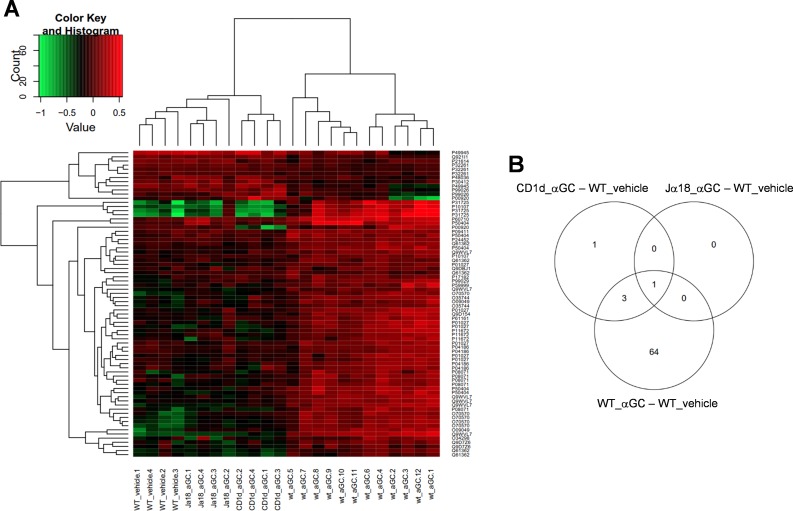
Fig 4. Hierarchial clustering and VENN-diagram of identified proteins.
A. Hierarchical clustering of protein spots in groups. Two main clusters are found; one consisting of 12 α-GalCer-treated WT samples, the other containing 8 α-GalCer-treated Jα18-KO and CD1d-KO mice samples and 4 vehicle-treated WT samples, which all look alike. Up-regulated protein abundances are shown in red and decreased proteins levels are in green. B. As the VENN diagram of the identified proteins shows, most of the differentially expressed protein spots lie between the vehicle and α-GalCer-treated WT samples.

