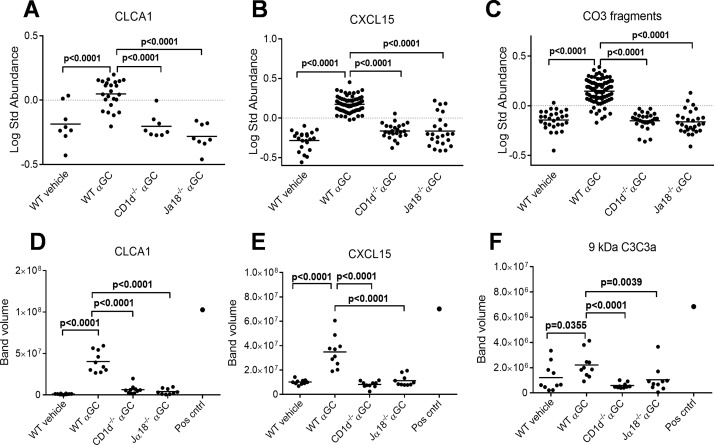
Fig 5. Western blot abundance differences for proteins selected for validation.
Protein levels of all identified CLCA1 (A), CXCL15 (B) and complement C3 fragments (C) are shown as dotplots in the study groups as log standard abundance of the gel spots from the DeCyder EDA program. Differences in immunoblot band volumes are shown for CLCA1 (D), CXCL15 (E) and 9 kD C3 fragment called anaphylatoxin C3a (F). Student’s t-test p values for significant protein level differences between α-GalCer—treated (αGC) WT mice and other groups are marked. A BALF sample from ovalbumin-sensitized and challenged mouse was used as a positive control for asthma (Pos cntrl).

