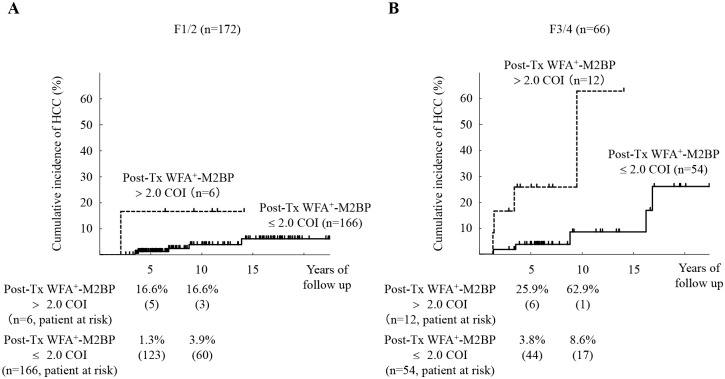
Fig 3. Cumulative incidence of hepatocellular carcinoma (HCC) according to post-treatment WFA+-M2BP values, stratified by stage of fibrosis.
(A): F1/2 (n = 172). (B): F3/4 (n = 66). Cumulative incidences of HCC according to post-treatment WFA+-M2BP values were analyzed using the Kaplan-Meier method. The black solid and dotted lines indicate the stratified post-treatment WFA+-M2BP values with a COI ≤ 2.0 and a COI > 2.0, respectively. There were no significant differences in HCC incidence with F1/2 group (P = 0.09 by the log-rank test). On the other hand, the incidence rate differed significantly with F3/4 group (P < 0.01 by the log-rank test). The numbers of patients at risk at each time point are shown below the graphs.

