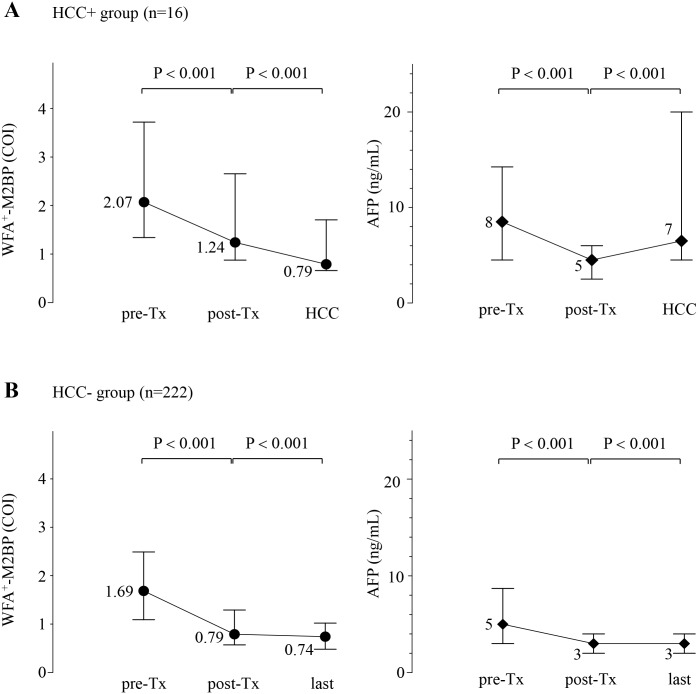
Fig 4. Chronological changes in the WFA+-M2BP and AFP values at pre-treatment, post-treatment, the time of HCC development, and the last visit of the 238 patients with sustained virological response.
Dots represent the median serum WFA+-M2BP values at each time point, and the error bar represents the interquartile range. Diamonds represent the median serum AFP values at each time point, and the error bar represents the interquartile range. (A): Patients who developed HCC (n = 16). WFA+-M2BP values were decreased at post-treatment and increased at HCC development. And AFP values were decreased at post-treatment and increased at HCC development. (B): Patients who did not developed HCC (n = 222). WFA+-M2BP values were decreased at post-treatment and last clinical visit. And AFP values were decreased at post-treatment and last clinical visit.

