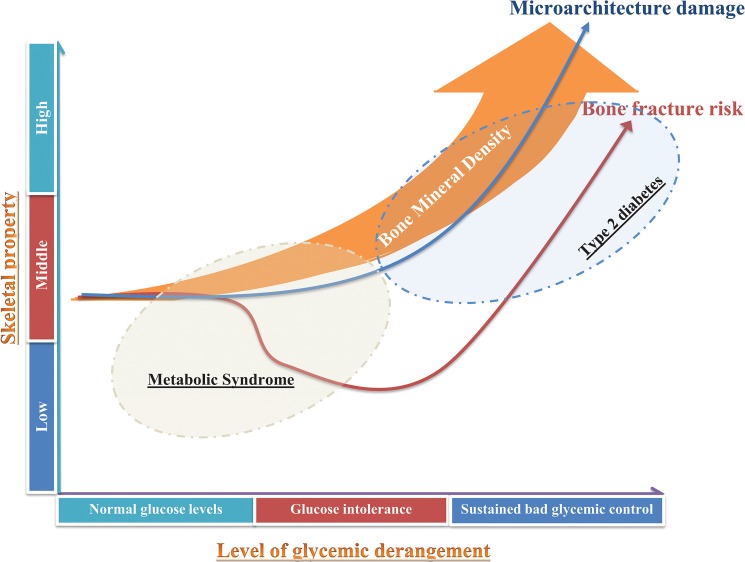
Fig 2. Level of glycemic derangement, bone architecture and fracture risk.
Cartoon depicting the differences in bone mineral density, fracture risk and changes in bone microarchitecture across the stages of glucose derangement. Metabolic syndrome and diabetes mellitus individuals have higher BMD but do not experience yet an increase in fracture risk. With sustained bad glycemic control, the damage of bone microarchitecture represented by accumulation of microcracks and cortical porosity becomes a possibility which may explain the bone fragility and fracture susceptibility despite the observed increase in BMD. Drawing is not to scale.

