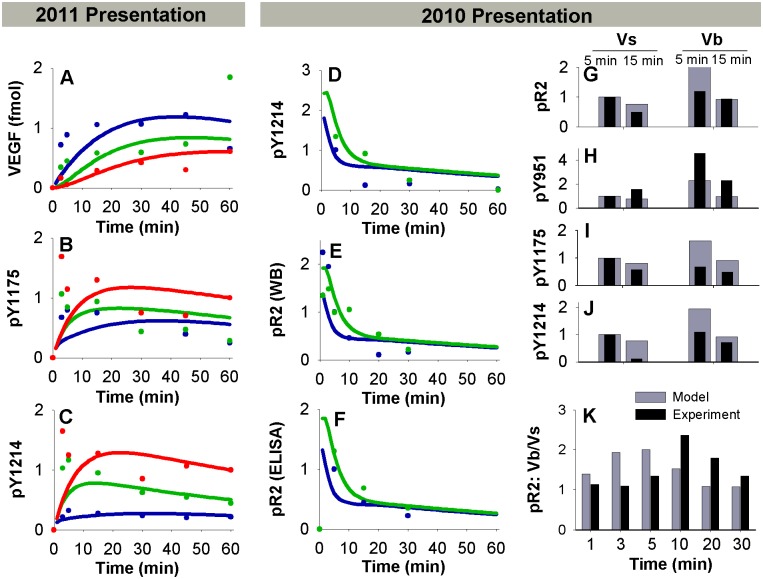
Fig 3. Prediction of VEGFR2 binding and phosphorylation parameters.
A. Total surface Vs·R2 + internal VEGF, used to fit koff,M·V for the 2011 presentation study [8]. Lines indicate simulation results, dots indicate experiments. Soluble VEGF (Vs), blue; electrostatic bound VEGF (Ve), green; covalent bound VEGF (Vc), red. B-C. pY1175 and pY1214 data for 2011 presentation study [8], which was used to fit dephosphorylation rate constants, along with H. D-F. Phosphorylation data from the 2010 presentation study [29], which was used to confirm dephosphorylation rate fits. D-E. Western blot data. F. ELISA data. Soluble VEGF, blue; bound VEGF, green. G-J. Additional phosphorylated VEGFR2 (by residue) experimental data from 2010 presentation study with model predictions. K. Ratio of pR2 for Vb and Vs at various times, from 2010 presentation study.

