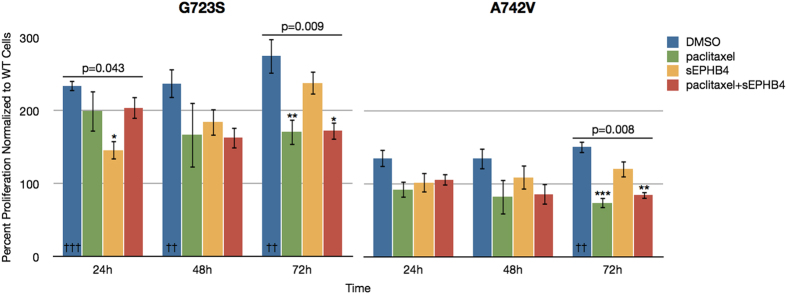
Figure 5. Cell proliferation and drug treatment in cells transfected with mutant EPHB4 in the presence of ephrin-B2 stimulation.

H661 cells transfected with EPHB4-G723S or EPHB4-A742V mutant constructs were exposed to ephrin-B2-Fc (1 μg/mL) and treated with DMSO (control), paclitaxel (0.5 μM), soluble EPHB4 (sEPHB4; 20 μg/mL), or paclitaxel plus sEPHB4, and the effects on cell proliferation were measured as previously described. Each condition was repeated in three replicates. Data are expressed as values normalized to EPHB4-WT cells at the same time point and experimental conditions. Error bars indicate SEM. Overall p values shown were calculated by one-way ANOVA for drug treatment at a single time point. Within single time points, * denotes p < 0.05, ** denotes p < 0.01, and *** denotes p < 0.001. †† denotes p < 0.01 and ††† denotes p < 0.001 in comparing each mutant construct without drug treatment to WT cells at the corresponding time point.
