
Figure 6. Broad changes in tyrosine kinase phosphorylation after EPHB4 modulation.
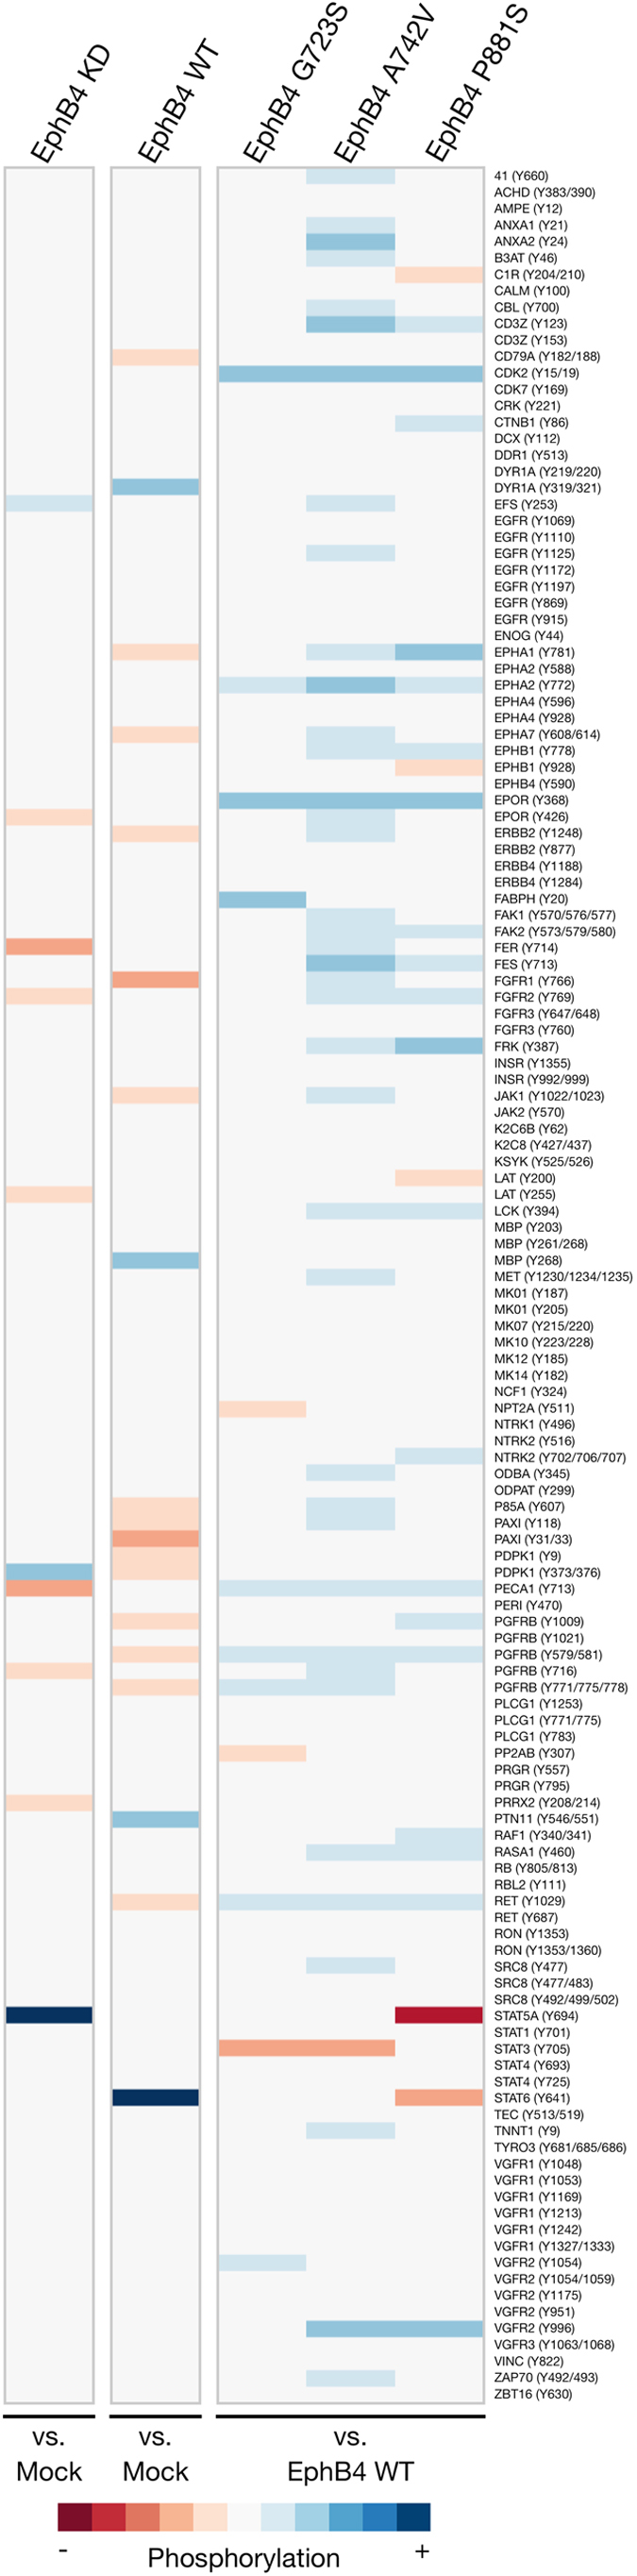
Heat maps demonstrate fold differences in peptide substrate phosphorylation using the PamGene platform. Peptides interrogated are listed to the right. Red tones indicate decreased phosphorylation and blue tones indicate increased phosphorylation compared to controls indicated below the heat map, and neutral color indicates either slight changes in phosphorylation or changes in phosphorylation that did not meet statistical significance (p < 0.05) across replicates. KD and WT samples were assayed in quadruplicate; mutant samples were assayed in triplicate.