
Figure 2. Separation and mobility of DNA molecules in the 3D nanowire structures.
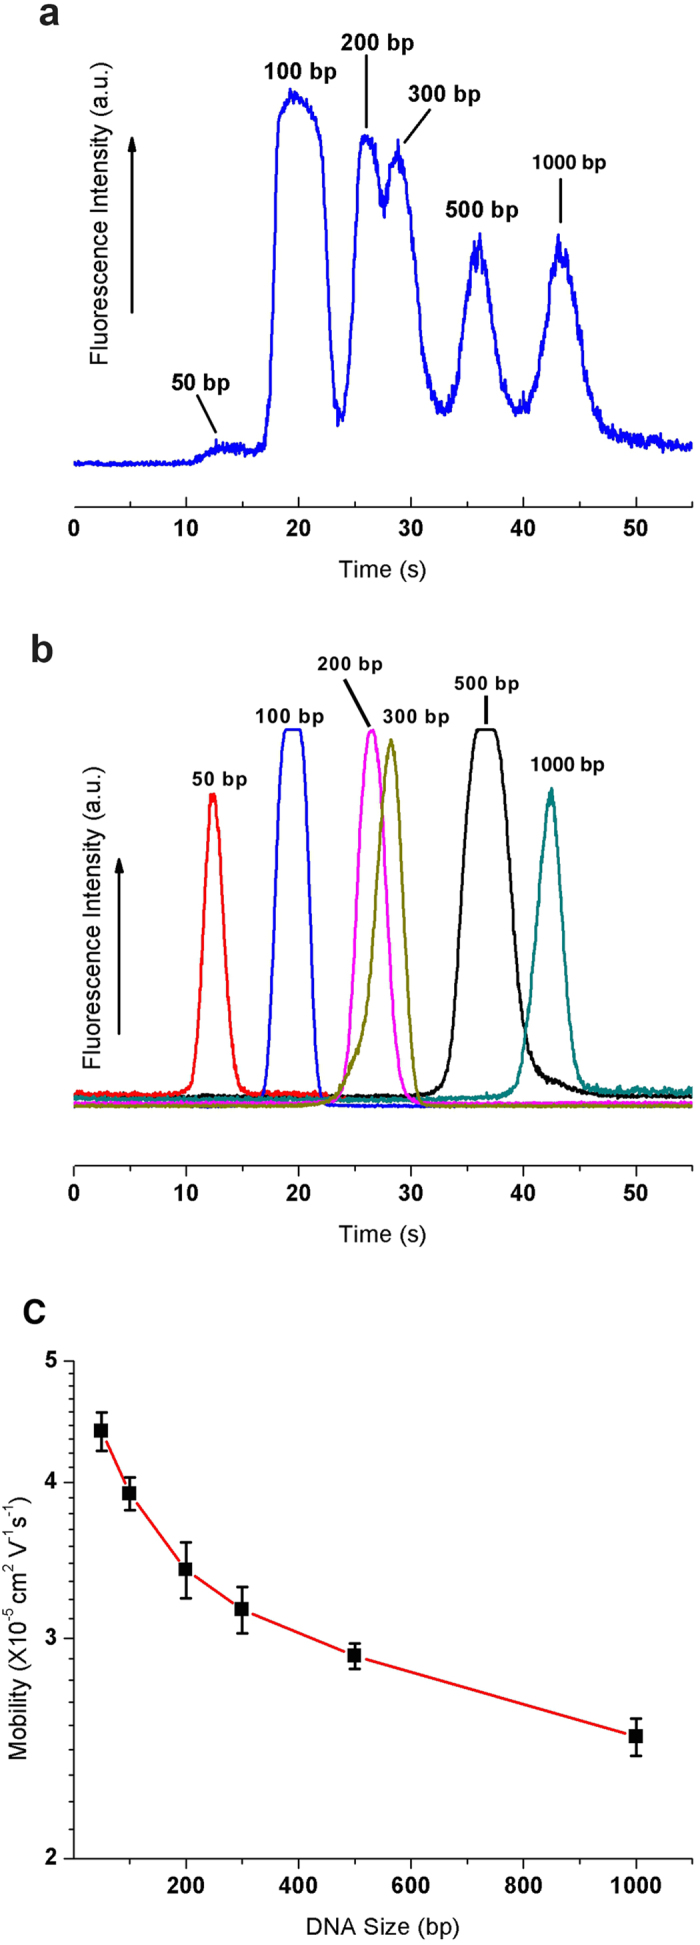
(a) Separation of 50 bp (40 ng/μL), 100 bp (30 ng/μL), 200 bp (30 ng/μL), 300 bp (30 ng/μL), 500 bp (30 ng/μL) and 1000 bp (30 ng/μL) molecules in the 3D nanowire structures. The electropherograms were obtained at 500 μm from the entrance of the 3D nanowire structures. The applied electric field in the separation channel was 100 V/cm. (b) The electropherogram of each type of DNA molecule to verify the migration time of each separation peak (E = 100 V/cm, L = 500 μm). (c) Semi-log plot of electrophoretic mobility as a function of DNA size under the applied electric field of 100V/cm.