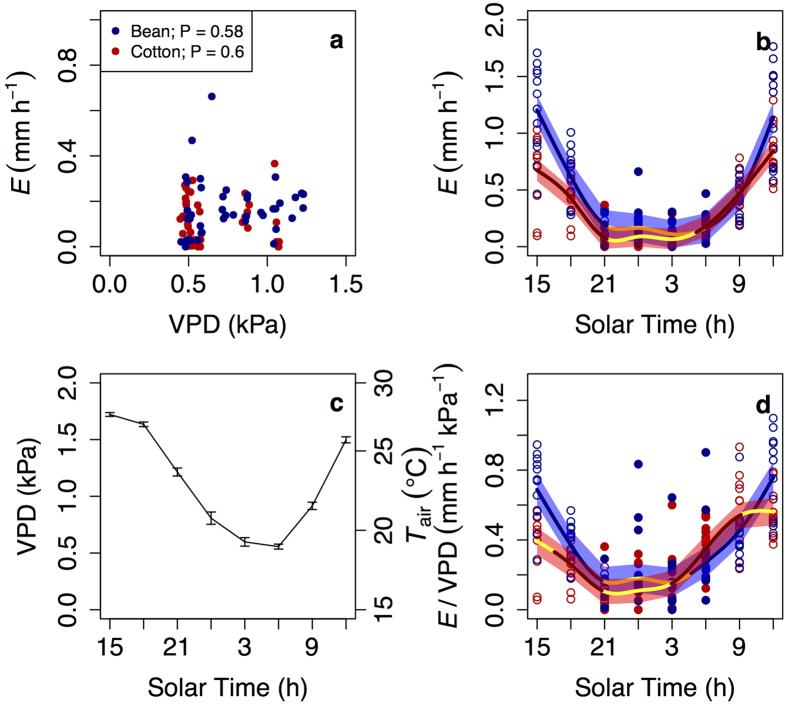
Figure 2. Temporal patterns of transpiration and drivers.
Transpiration (E) remained constant overnight (b), and was not driven by vapour pressure deficit (VPD, a). The interaction between a declining VPD and air temperature (Tair) early in the night (c) and an increase in canopy conductance (as indicated by E/VPD) later in the night (d) led to non-significant variation in E (a). Empty and filled dots mean daytime and night-time values, respectively. Lines (and shaded error intervals) indicate the prediction (and SE) of Generalized Additive Mixed Model (GAMM) fitting separately for each species (some lines may overlap), and significant temporal variation occurs only when the GAMM best-fit line is not yellow. Each dot represents the mean across 3–4 measuring nights for each of the 6 macrocosms per species and for each of the two radiation treatments. No differences in VPD across experiments and species existed (at P < 0.05), and only the mean pattern (and SE) is shown. A single line is fitted for both radiation environments given lack of differences in night-time rates (see text).

