
Figure 2. The CHK inhibitor PF-0477736 shows potent antiproliferative activity in aggressive B-cell lymphoma cells.
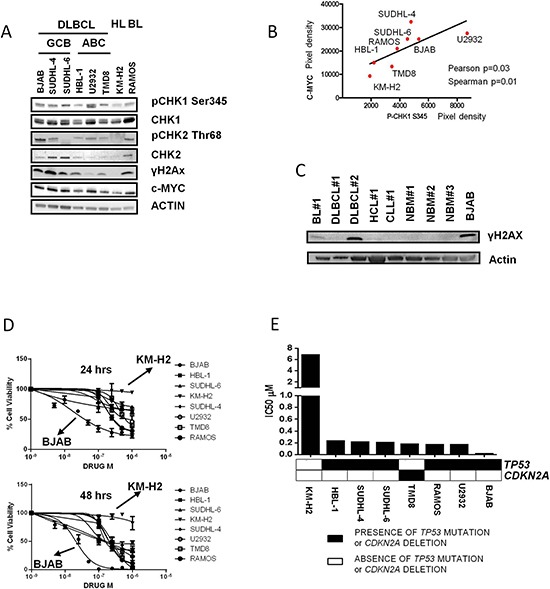
(A) Western immunoblotting showing the activation status of the DDR pathway and the expression of the DNA damage marker γH2AX in DLBCL, BL, and HL cells. The GCB-derived DLBCL cell lines BJAB, SUDHL-4, SUDHL-6, the ABC-derived cell lines HBL-1, U-2932, TMD8, the BL cell line RAMOS and the HL cell line KM-H2 were harvested during the exponential growth phase, and assessed for the expression levels of pCHK1 ser345, CHK1, pCHK2 thr 68, CHK2, γH2AX, and c-MYC. (B) Graph showing correlation between c-MYC and pCHK1 ser 345 expression levels in our panel of B-cell lymphoma cell lines, as evaluated by densitometry analysis using the ImageJ software (National Institutes of Health, Bethesda, MD). Pixel density is expressed in arbitrary units. The p value of the correlation was calculated with Spearman and Pearson's tests. (C) Western blot assay showing the expression of the DNA damage marker γH2AX in primary aggressive B-cell lymphoma cells, indolent B-cell lymphoma cells, and normal bone marrow progenitors. BL (Burkitt lymphoma), DLBCL (Diffuse large B-cell lymphoma), CLL (Chronic Lymphocytic Leukemia), HCL (Hairy Cell Leukemia), NBM (Normal bone marrow mononucleated cells). The BJAB cell line was used as a positive control. (D) WST-1 assay of DLBCL, BL, HL cell lines treated with increasing concentrations of the CHK 1/2 kinase inhibitor PF-0477736 for 24 and 48 hours. Each value is the mean of three independent experiments performed in triplicate. Error bars represent standard error of the mean (s.e.m). (E) IC50 values after 48 hours of incubation with PF-0477736. After 48 hours of incubation with PF-0477736 the DLBCL GCB-derived BJAB cells were the most sensitive with an IC50 value of 9 nM. All other DLBCL cell lines were sensitive to nanomolar concentrations of PF-0477736, displaying IC50 values between 160 and 230 nM. Only the HL derived KM-H2 cells were resistant to treatment with an IC50 value of 7 μM at 48 hours. The black and white squares represent the presence or absence of TP53 mutations and/or CDKN2A deletions in DLBCL cells.