
Figure 2. Inhibition of S100A6 suppressed cell proliferation in vitro and vivo, and effected the G2/M phase.
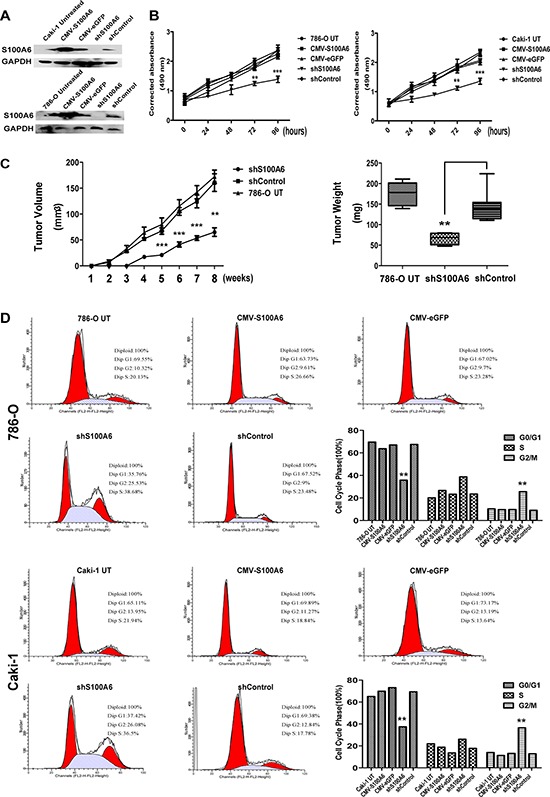
(A) Western blot assayed to identify the transfection efficiency of the 786-O and Caki-1 S100A6 stable cells, using the 786-O and Caki-1 untreated cells as control. The efficiency was satisfactory. (B) The proliferation curve by MTS assays showed that overexpression of S100A6 did not promote the 786-O and Caki-1 cells growth, whereas knockdown of S100A6 suppressed the cells growth. The data were expressed as mean ± SD. (C) Tumor growth curve of shS100A6, shControl and 786-O Untreated cells in nude mice. Tumor sizes were determined as described in the Materials and Methods. The tumor weight derived from the shS100A6 group was lower than from the shControl and 786-O untreated groups when nude mice were sacrificed at 8 weeks after injection. The data show as the min to max of tumor weight. (D) Influence of S100A6 in 786-O and Caki-1 cells on cell cycle distribution. 786-O and Caki-1 cells were stable transfected by overexpression and knockdown of S100A6, compared to vector control respectively and untreated cells control. The overexpression of S100A6 in both cell lines showed no differences in cycling phase distribution comparing to the empty vector control. The shS100A6 groups in both cell lines showed a lower percentage in G0/G1 phase and a higher percentage in G2/M phase comparing to the shControl and untreated cells control. *p < 0.05; **p < 0.01; ***p < 0.001.