
Figure 1. CSC technology enables the identification and quantitative comparison of the surface glycoproteome of human chemosensitive and chemoresistant colon cancer cells.
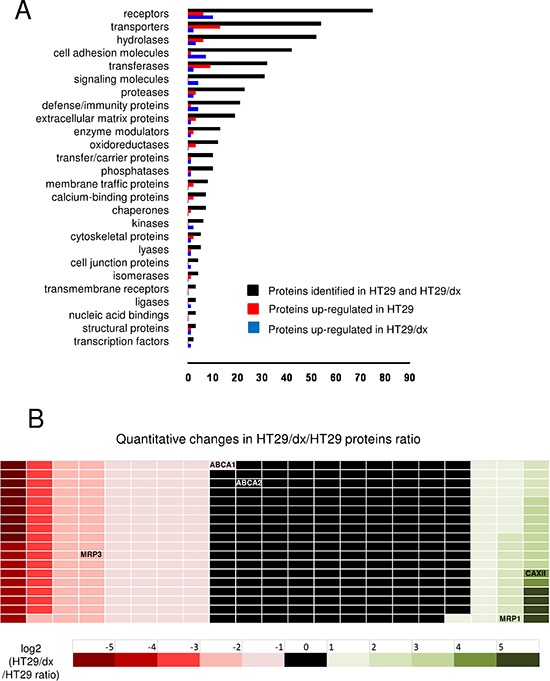
(A) 380 identified plasma membrane-associated proteins (black bars) from human chemosensitive colon cancer HT29 cells and human chemoresistant colon cancer HT29/dx cells were categorized according to the biological function assigned by the PANTHER algorithm. (B) Quantitative analysis of the proteins detected by CSC technology. The ratio between protein expressed in HT29/dx cells and protein expressed in HT29 cells is represented by a colorimetric logarithmic scale. CAXII, ABCC1/MRP1, ABCC3/MRP3, ABCA1 and ABCA2 hits are indicated.