
Figure 2. Expression of CAXII in chemosensitive and chemoresistant human cancer cells.
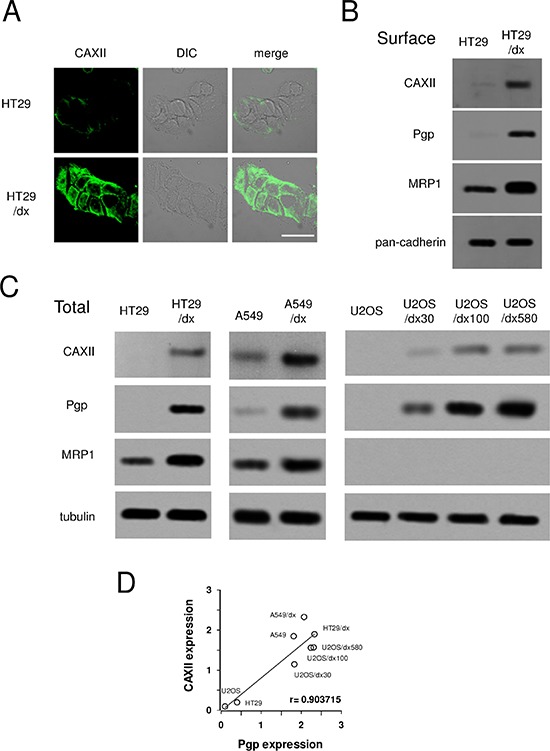
Human chemosensitive colon cancer HT29 cells and their chemoresistant counterpart HT29/dx cells, human chemosensitive lung cancer A549 cells and their chemoresistant counterpart A549/dx cells, human chemosensitive osteosarcoma U2-OS cells and the chemoresistant clones U2-OS/dx 30, U2-OS/dx 100, U2-OS/dx 580 were subjected to the following assays. (A) Confocal microscope analysis of HT29 and HT29/dx cells stained for CAXII. The samples were analyzed by laser scanning confocal microscope for green fluorescence signal (CAXII) or by Nomarski differential interference contrast (DIC) optics. Magnification: 60 × objective; 10 × ocular lens. Bar = 20 μm. (B) Western blot analysis of biotinylated plasma membrane associated CAXII, Pgp and MRP1 in HT29 and HT29/dx cells. The pan-cadherin expression was used as a control of equal protein loading. The figure is representative of three experiments with similar results. (C) Whole cell lysates were analyzed by Western blotting for the expression of CAXII, Pgp and MRP1. The β-tubulin expression was used as a control of equal protein loading. The figure is representative of three experiments with similar results. (D) Linear regression analysis between CAXII and Pgp expression. The mean band density of CAXII and Pgp (panel C), expressed as arbitrary units, was calculated by ImageJ software (http://www.rsb.info.nih.gov/ij/). r coefficient was calculated using Fig. P software (Fig. P Software Inc., Hamilton, Canada).