
Figure 7. CAIX does not mediate chemoresistance to Pgp substrates in colon cancer cells.
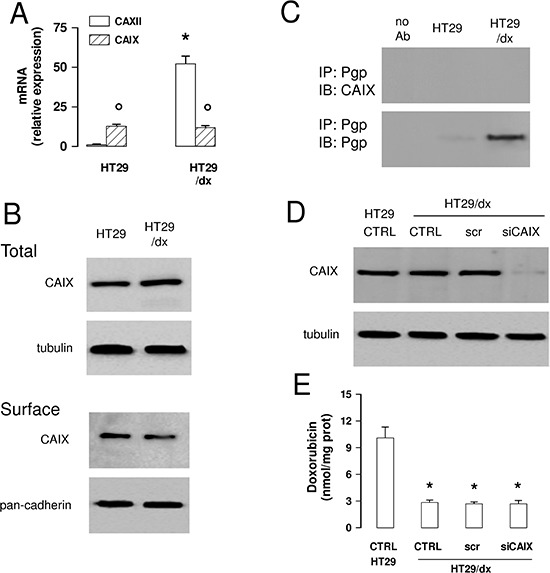
(A) The CAIX mRNA level in HT29 and HT29/dx cells was detected by qRT-PCR. CAXII mRNA level is shown for comparison. Data are presented as means ± SD (n = 4). Versus HT29: *p < 0.001; for both HT29 and HT29/dx cells, CAIX versus CAXII expression: ° p < 0.001. (B) Western blot analysis of CAIX expression in whole cell lysates (upper panel; Total) and biotinylated plasma membrane-derived extracts (lower panel; Surface) in HT29 and HT29/dx cells. The β-tubulin and pan-cadherin expression were used as controls of equal protein loading in whole cell lysates and plasma membrane-derived extracts, respectively. The figure is representative of three experiments with similar results. (C) Biotinylated plasma membrane-derived extracts from HT29 and HT29/dx cells were immunoprecipitated (IP) with an anti-Pgp antibody, then immunoblotted (IB) with an anti-CAIX or an anti-Pgp antibody. no Ab: samples immunoprecipitated without antibody. The figure is representative of three experiments with similar results. (D) HT29/dx cells were cultured for 48 h with fresh medium (CTRL), treated with a non targeting scrambled siRNA (scr) or with a CAIX-targeting specific siRNA pool (siCAIX). HT29 cells were included as control. The expression of CAIX was measured in whole cell lysates by Western blotting. The β-tubulin expression was used as a control of equal protein loading. The figure is representative of three experiments with similar results. (E) HT29/dx cells treated as reported in D were incubated for 24 h with 5 μmol/L doxorubicin, then the intracellular drug content was measured fluorimetrically. HT29 cells were included as control of chemosensitive cells. Data are presented as means ± SD (n = 4). Versus HT29 CTRL: *p < 0.001.