
Figure 2. Module 1 gene expression dynamics are associated with therapy response.
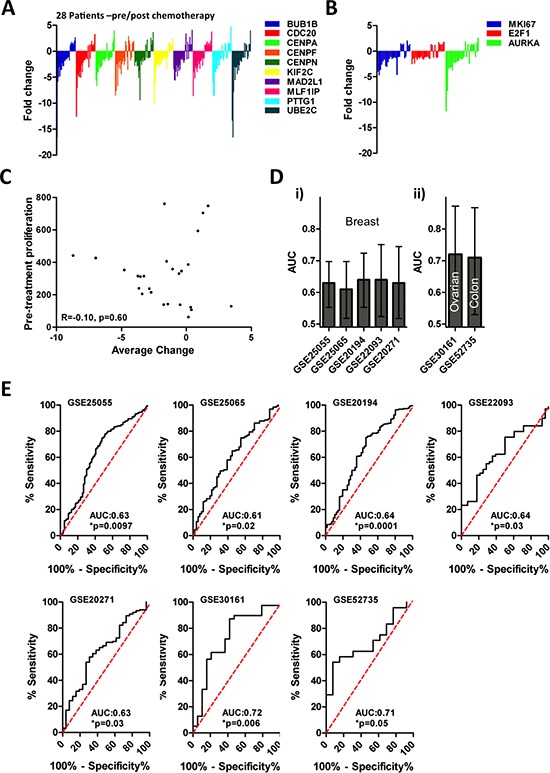
(A) Dynamics of module 1 gene expression following therapy is heterogeneous. (B) Dynamics of proliferation gene expression following therapy is heterogeneous. (C) There is no relationship between Module 1 gene expression prior to therapy and changes in Module 1 gene expression after therapy (R = −0.1, p = 0.60). (D) The RS predicts patient response to chemotherapy among breast cancer (i) as well as ovarian and colon (ii) cancer patients, RS is a significant predictor in each dataset (*p < 0.05, AUC > 0.5). (E) ROC analysis of RS in chemotherapy response in 5 breast cancer datasets, one ovarian cancer dataset, and one colon cancer data set.