
Figure 1. Structural modeling, analysis and virtual screening of the ATP-binding pocket of SK1.
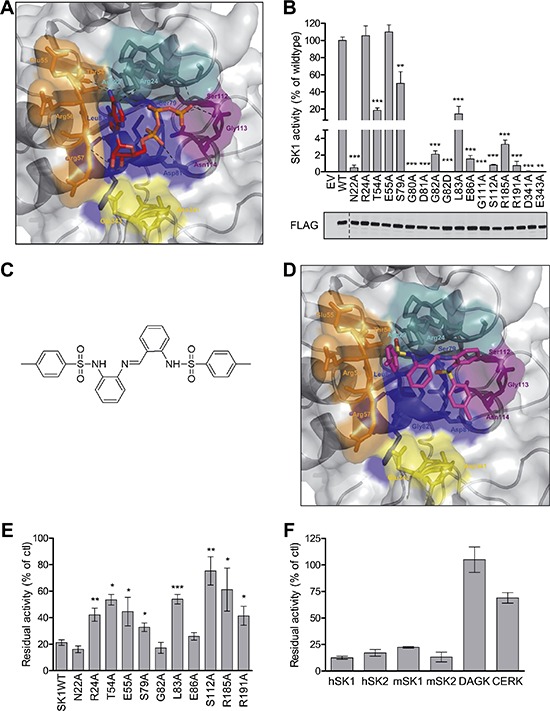
(A) The predicted structure of the ATP-binding pocket of SK1 represented in surface view with ATP docked into the pocket (sticks). Each of the regions highly conserved in all SKs (see Supplementary Figure 1) that comprise the ATP-binding pocket are colored separately; Motif 1 (21LNPRGG26) in teal, Motif 2 (54TERR57) in orange, Motif 3 (79SGDGLMHE86) in blue, Motif 4 (110GSGN114) in purple, and Motif 5 (340VDGE343) in yellow. The atoms in ATP are colored according to chemical elements; oxygen in red, and nitrogen in blue. Predicted hydrogen bonding is depicted by black dashes. (B) Mutagenesis of SK1 at residues predicted to be important in ATP binding and assessment of residual SK1 activity (upper panel) confirmed the validity of the SK1 ATP-binding site model. SK1 activities were determined after overexpression in HEK293T cells, and presented as % activity compared to wildtype SK1 (WT). Empty vector (EV) transfected cells show negligible contribution from endogenous SK to the activities displayed. The lower panel shows similar expression levels of all FLAG-tagged SK1 variants, but activities were adjusted for slight variations in expression. Data shown are mean ± SD, n = 4). Significance compared to WT was determined by student t-test (*p < 0.05, **p < 0.01 and ***p < 0.001). (C) The chemical structure of MP-A08. (D) The ATP binding pocket of the SK1 model with MP-A08 docked. Coloring is the same as for Figure 1A, with yellow atoms representing sulphur. (E) Effect of MP-A08 (250 μM) on the activity of SK1 variants harboring mutations in the ATP-binding site. Data are represented as % activity compared to vehicle control. All data shown are mean ± SD (n = 4), significance compared to SK1WT was determined by student t-test (*p < 0.05, **p < 0.01 and ***p < 0.001). (F) Selectivity of MP-A08 (0.1 mg/ml, 192 μM) was initially assessed against human SK1, SK2, DAGK and CERK, and murine SK1 and SK2. Data are represented as % activity compared to vehicle control. All data shown are mean ± SD (n = 4).