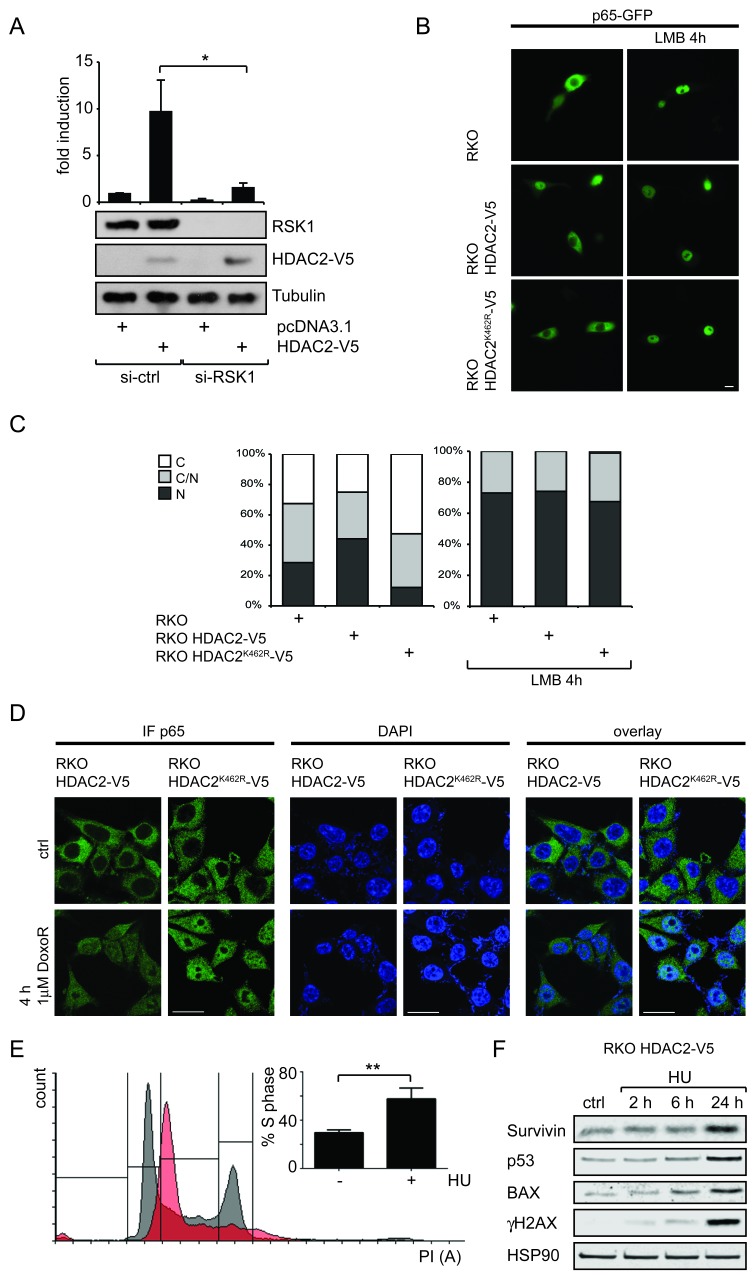
Figure 4. Connection of RSK1 activity and subcellular localization of p65 toward HDAC2 induction of NF-κB.
(A) Knockdown of RSK1 diminishes HDAC2-caused NF-κB reporter gene induction; n=4. (B) Representative image of RKO, RKO HDAC2-V5 and RKO HDAC2K462R-V5 cells transfected with p65-GFP, showing enhanced nuclear localization of p65 in RKO HDAC2-V5 cells. Inhibition of nuclear export by Leptomycin B (LMB) leads to nuclear retention of p65-GFP regardless of HDAC2 status. (C) Quantification of (D) counting at least 100 cells in two independent experiments. C and N depict predominantly (> 80%) cytosolic or nuclear localization of p65-GFP, respectively, C/N = intermediate distribution of p65-GFP. (D) RKO HDAC2-V5 and RKO HDAC2K462R-V5 cells were treated with 1μM doxorubicin (DoxoR) for 4 h or left untreated for control. Fixed cells were stained with antibodies against p65 and visualized with Cy2 or Cy3 labeled secondary antibody. DNA was stained by mounting medium containing DAPI. Brightness levels for p65 were adjusted for RKO HDAC2-V5 ctrl (45), RKO HDAC2K462R-V5 ctrl (35) and DoxoR (35, all from original 50). Brightness for DAPI was adjusted for RKO HDAC2K462R-V5 cells DoxoR (to 45 from original 50). Scale bar = 20 μm. (E) RKO HDAC2-V5 cells were treated with 1.5 mM Hydroxyurea (HU) for 24 h and cell cycle distribution was analyzed by PI staining. The bar diagram shows the amount of cells in S-Phase of n=5 experiments; ± sem, ** = p<0,01. A histogram for one representative experiment shows cell cycle profile of control cells in black and of HU treated cells in red. (F) RKO HDAC2-V5 cells were treated with 1.5 mM HU for 2, 6 and 24 h or left untreated for control. Levels of the indicated proteins were analyzed by Western blot.

