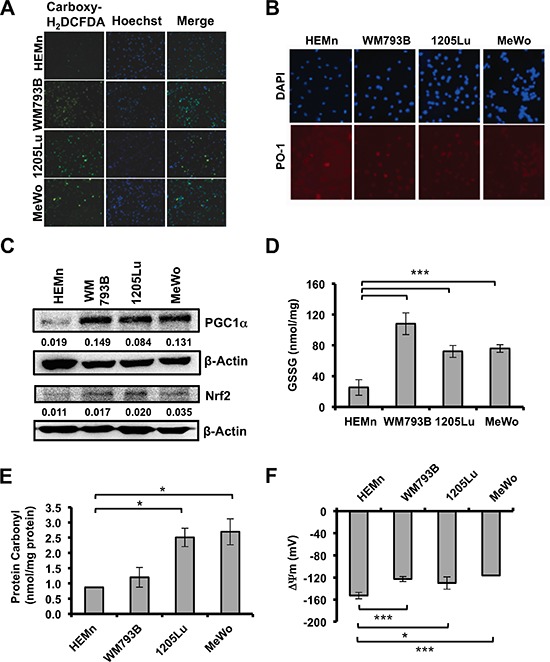
Figure 1. Basal ROS and oxidative stress markers in melanoma cells and melanocytes.

(A) Fluorescent micrographs showing total intracellular ROS by carboxy-H2DCFDA, nuclear counterstain by Hoechst, and merged image in melanocytes (HEMn) and melanoma cells (WM793B, 1205Lu, MeWo) at 10X magnification. (B) Evaluation of basal H2O2-specific ROS by Peroxy Orange 1 (PO-1), 20X magnification. (C) Basal protein levels of PGC1α and NRF2 by western blotting. Quantification of band densitometry is shown below, relative to β-actin loading control. (D) Basal level of oxidized intracellular glutathione (GSSG; nmol/mg protein) determined using luminescence-based assay. (E) Intracellular protein carbonylation used as a measure of protein damage, determined by ELISA. (F) Mitochondrial membrane potentials (ΔΨ) were determined using Nernst equation derivative. Data are presented as means of three independent experiments. Statistical analysis was performed using Student's t-test. Significance values; *indicates p ≤ 0.05; and ***indicates p ≤ 0.001.
