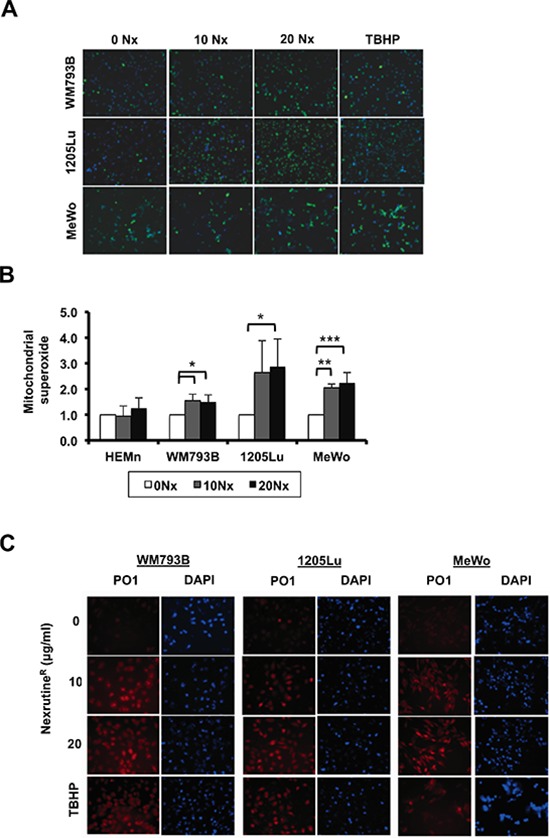
Figure 2. NexrutineR modulates total and mitochondrial ROS in melanoma cells.

(A) Fluorescent micrographs (10X magnification) merged with Hoechst nuclear stain showing total ROS (by carboxy-H2DCFDA) after treatment for 3 h with vehicle control, increasing doses of NexrutineR (10 and 20 μg/ml), or positive control TBHP. (B) Mitochondrial superoxide production, relative to vehicle control in melanocytes (HEMn) and melanoma cells after NexrutineR (10 and 20 μg/ml; 3 h). (C) Induction of H2O2-specific ROS by NexrutineR (3 h) evaluated by PO-1 dye in WM793B, 1205Lu, and MeWo, 20X magnification. TBHP (100 μM; 3 h) was used as positive control. Significance values; *indicates p ≤ 0.05; **indicates p ≤ 0.01 and ***indicates p ≤ 0.001.
