
Figure 6. Free ISG15 and not ISGylation contributes to increased MHC class I surface expression in breast cancer cells.
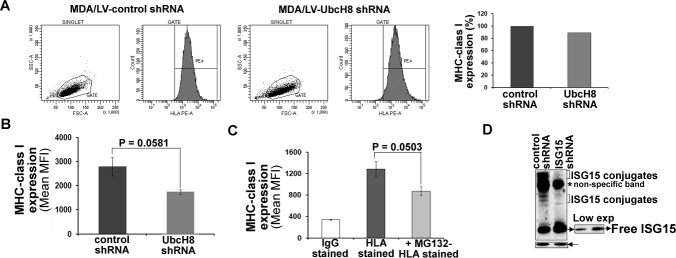
A, A representative graph of flow cytometric analysis of MHC class I surface expression on MDA/LV-control and UbcH8 shRNA cells is shown. Bar graph shows the quantification of the flow cytometric data shown in A. B, Experiment shown in panel A was repeated three times and the mean values of the median fluorescence intensity are plotted in the bar graph. B) Reappearance of MHC class I surface expression was measured (three experiments) in the presence/absence of MG132. C, Expression of ISG15 and conjugates using anti-ISG15 antibodies is shown. All bars: +/− SEM.