
Figure 6. Kaplan-Meier curve of overall survival in patients with stage II disease.
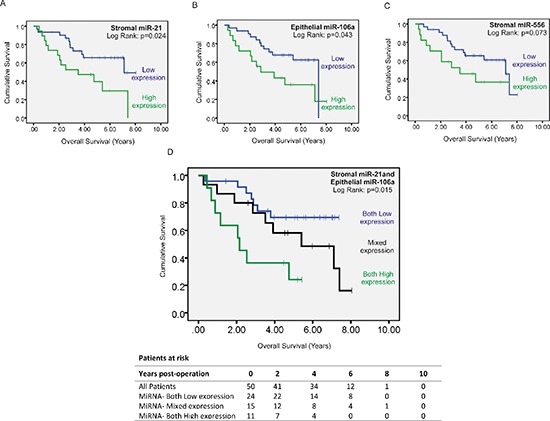
Patients were stratified into high or low expression groups based around group mean stromal miR-21 expression (A) group mean epithelial miR-106a expression (B) and group mean stromal miR-556 expression (C) As elevated stromal miR-21 and epithelial miR-106a expression predicted significantly reduced overall survival they were included in combined analysis (D) whereas stromal miR-556 expression was excluded.