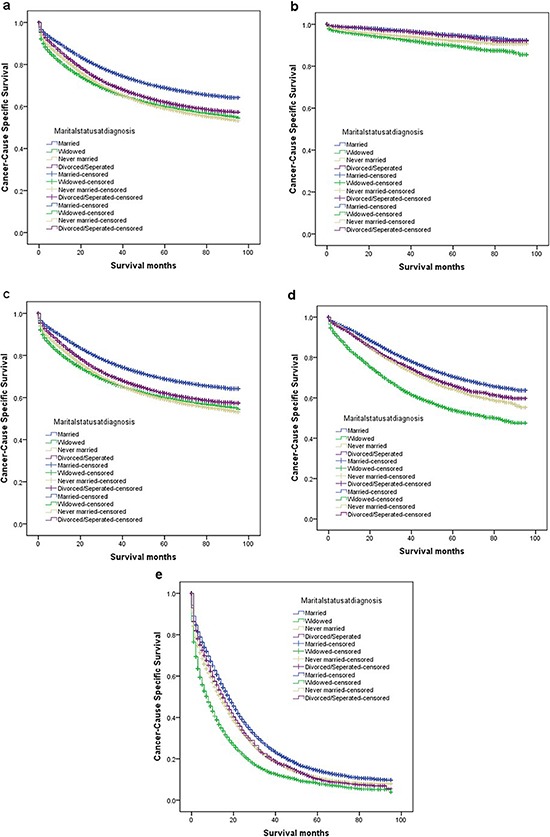
Figure 1. Survival curves in colorectal patients according to marital status.

(a) stage I-IV: χ2 = 1096.367, P < 0.001; (b) stage I: χ2 = 154.618, P < 0.001; (c) stage II: χ2 = 346.777, P < 0.001; (d) stage III: χ2 = 646.624, P < 0.001; (e) stage IV: χ2 = 602.869, P < 0.001.
