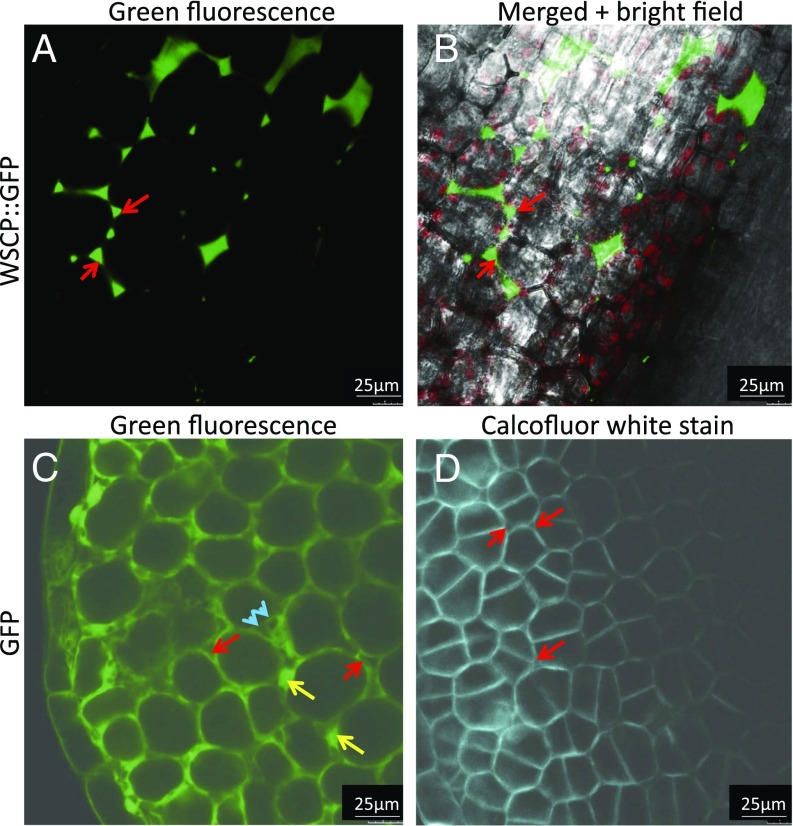
Fig. 3.
Localization of AtWSCP::GFP in planta. (A and B) Fluorescence analysis of AtWSCP::GFP accumulation in the cotyledons of etiolated seedlings of respective transgenic plants of the T3 generation. (C) Localization of GFP in T3 plants expressing GFP without AtWSCP attached to it. (D) Calcofluor white stain to visualize cell walls in AtWSCP::GFP plants. Red flashes mark apoplastic spaces, yellow flashes mark GFP fluorescence in cytoplasm and nuclei, whereas blue arrowheads indicate sparing of GFP fluorescence by plastids.

