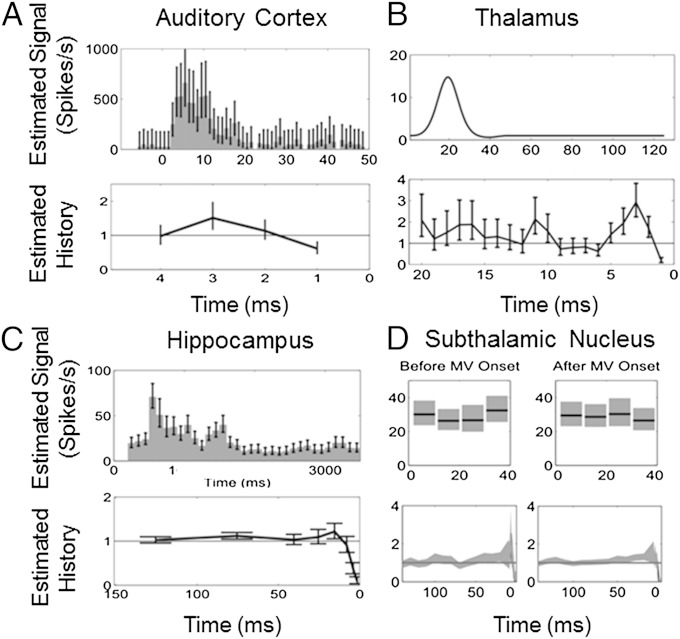
Fig. 2.
Stimulus and history component estimates from the PP-GLM analyses of the spiking activity in Fig. 1. (A) Guinea pig primary auditory cortex neuron. (B) Rat thalamic neuron. (C) Monkey hippocampal neuron. (D) Human subthalamic nucleus neuron. The stimulus component (Upper) is the estimated stimulus-induced effect on the spike rate in A, C, and D and the impulse response function of the stimulus in B. The history components (Lower) show the modulation constant of the spike firing rate.

