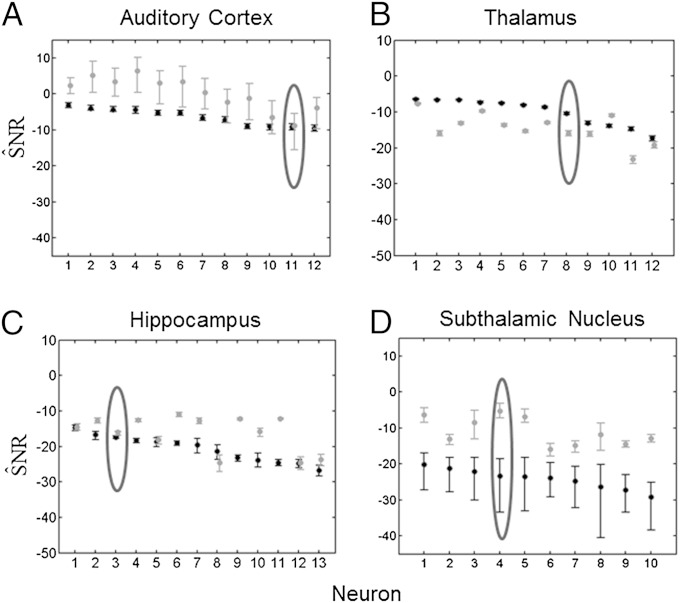
Fig. 3.
KL-based SNR for (A) 12 guinea pig auditory cortex neurons, (B) 12 rat thalamus neurons, (C) 13 monkey hippocampal neurons, and (D) 10 subthalamic nucleus neurons from a Parkinson's disease patient. The black dots are , the SNR estimates due to the stimulus correcting for the spiking history. The black bars are the 95% bootstrap confidence intervals for . The gray dots are , the SNR estimates due to the intrinsic biophysics of the neuron correcting for the stimulus. The gray bars are the 95% bootstrap confidence intervals for . The encircled points are the SNR and 95% confidence intervals for the neural spike train raster plots in Fig. 1.

