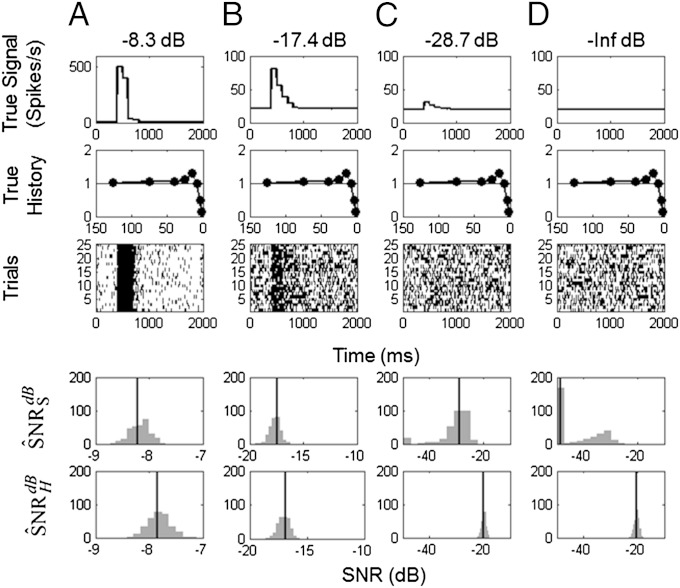
Fig. 4.
KL-based SNR of simulated neurons with stimulus and history components. The stimulus components were set at four different SNRs: (A) −8.3 dB, (B) −17.4 dB, (C) −28.7 dB, and (D) –∞ dB, where the same spike history component was used in each simulation. For each SNR level, 300 25-trial simulations were performed. Shown are (row 1) the true signal; (row 2) the true spike history component; (row 3) a raster plot of a representative simulated experiment; (row 4) histogram of the 300 , the SNR estimates due to the stimulus correcting for the spiking history; and (row 5) histogram of the 300 , the SNR estimates due to the intrinsic biophysics of the neuron correcting for the stimulus. The vertical lines in rows 4 and 5 are the true SNRs.

