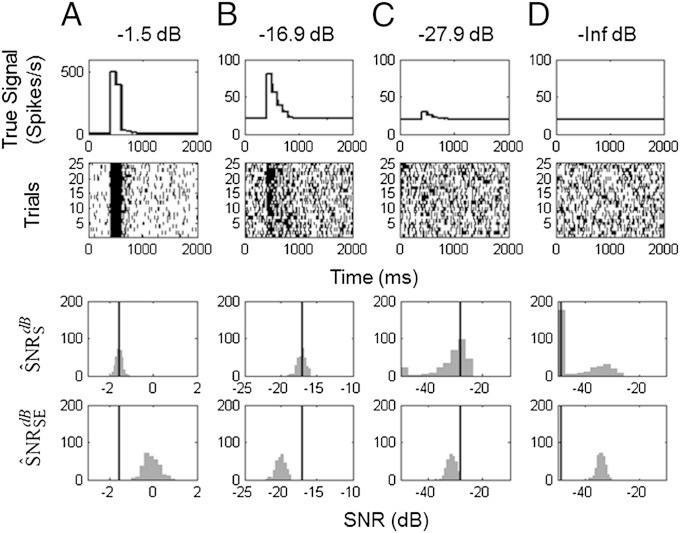
Fig. 5.
A comparison of SNR estimation in simulated neurons. The stimulus components were set at four different SNRs: (A) −1.5 dB, (B) −16.9 dB, and (C) −27.9 dB with no history component. For each SNR level, 300 25-trial simulations were performed. Shown are (row 1) the true signal; (row 2) a raster plot of a representative simulated experiment; (row 3) histogram of the 300 KL-based SNR estimates, ; and (row 4) histogram of the 300 squared error-based SNR estimates, (20). The vertical lines in rows 3 and 4 are the true SNRs.

