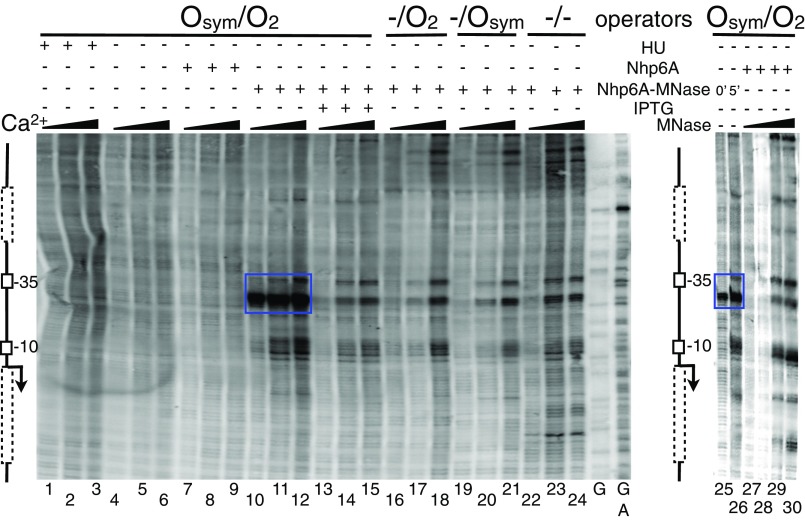
Fig. 3.
In vivo mapping of Nhp6A-MNase fusion protein bound to the lac promoter region of the F′ episome using ChEC-LMPCR. Bacterial cultures were grown to log phase in the presence or absence of 2 mM IPTG, as indicated. Formaldehyde cross-linked bacterial lysates were then analyzed. Flanking schematic diagrams are as in Fig. 2. Where indicated, cleavage by the endogenous MNase fusion protein was activated for 0, 5, or 10 min by addition of 10 mM Ca2+. As a control, increasing concentrations of commercial MNase were added to cross-linked lysates containing expressed Nhp6A (lanes 27–30). Sequencing ladders (G and G+A) were as described in Fig. 2. Blue box indicates Nhp6A binding. Data are representative of at least three replicates.

