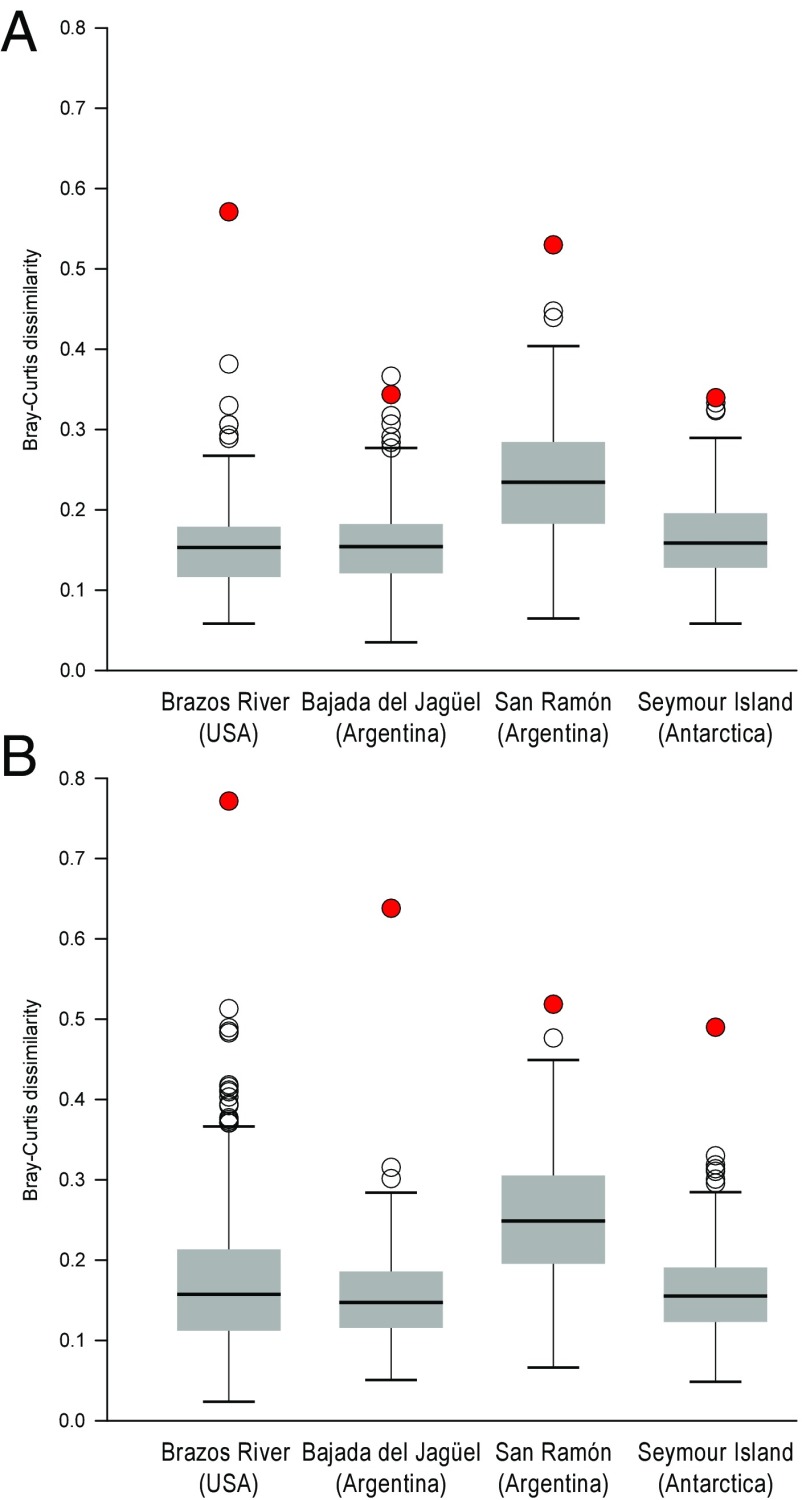
Fig. 2.
Ecological dissimilarity between preextinction and postextinction molluscan assemblages compared with patterns based on randomized data. (A) Comparison based on full datasets. (B) Comparison after removing species that disappeared in the latest Maastrichtian. Filled circles indicate the observed Bray-Curtis dissimilarity. The box plots show the distribution of dissimilarity values in 500 permutation trials. The solid black lines inside the boxes represent the medians, the Top and Bottom edges of the boxes correspond to the first and third quartiles, and whiskers represent 1.5 times the interquartile range. Points outside the whiskers are outliers (open circles).

