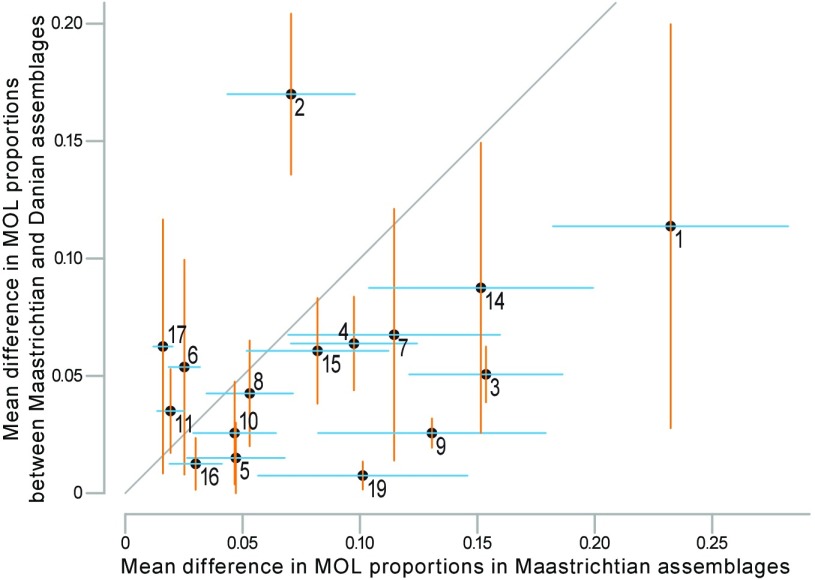
Fig. 4.
Comparison of ecological change in time with ecological variability in space. The mean difference in proportional abundance of modes of life (MOLs 1–19, see key in Fig. 1) between pre- and postextinction assemblages at each site is plotted against the mean difference across the four studied sites in Maastrichtian assemblages. The diagonal line indicates equality of mean temporal change and mean spatial variation. The horizontal and vertical lines associated with each MOL represent one SE in each direction.

