Fig. 1.
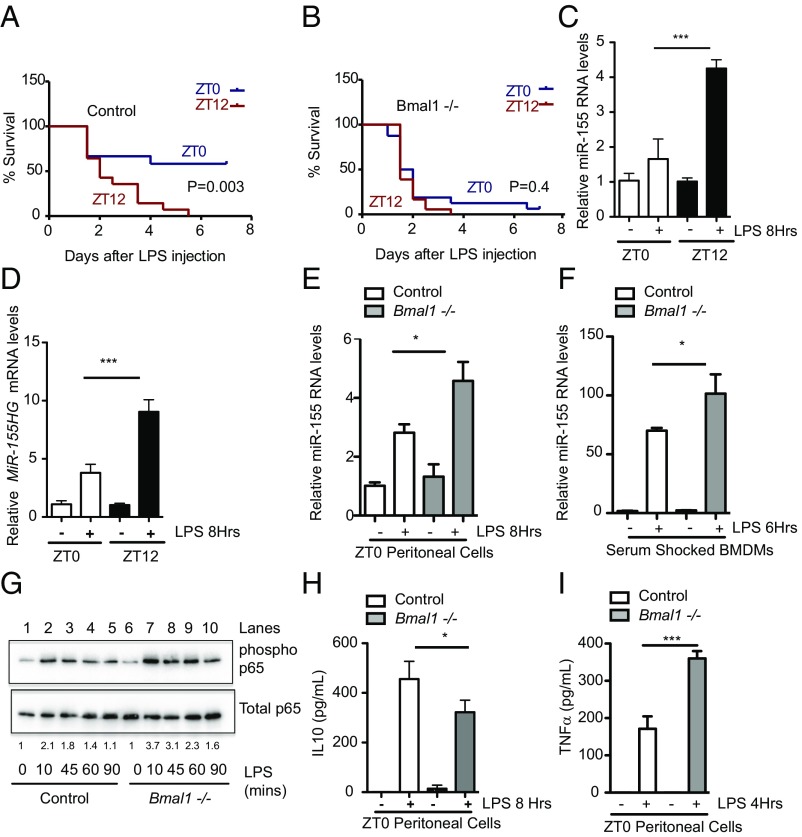
The magnitude of the circadian response to sepsis and inflammation correlates with induction of the microRNA miR-155. (A) Bmal1+/+Lys-MCre (n = 12–18) or (B) Bmal1−/−Lys-MCre male mice (n = 12–18) were injected intraperitoneally with LPS (25 mg/kg) at ZT0 (blue line) or ZT12 (red line) and monitored for survival over 7 d. Wild-type peritoneal cells harvested at ZT0 and ZT12 and treated immediately ex vivo with LPS (100 ng/mL) for indicated times and analyzed for expression of (C) mature miR-155 and (D) MiR-155HG (n = 3–4). Peritoneal cells harvested at ZT0 from Bmal1+/+Lys-MCre and Bmal1−/−Lys-MCre mice and treated immediately ex vivo with LPS (100 ng/mL) for the indicated time and analyzed for expression of (E) miR-155 (n = 3–4). (F) Serum-shocked BMDMs from Bmal1+/+Lys-MCre and Bmal1−/−Lys-MCre treated with LPS (100 ng/mL) for the indicated time and analyzed for expression of miR-155 (n = 3). (G) Peritoneal cells harvested at ZT0 from Bmal1+/+Lys-MCre and Bmal1−/−Lys-MCre mice, treated immediately ex vivo with LPS (1 ng/mL) for indicated times, and analyzed by immunoblot for levels of phosphorylated p65 at Serine 536 and total p65. Blot is representative of n = 6. Values provided are relative band intensity of phospho/total 65. Peritoneal cells as in E were analyzed for protein levels of (H) IL10 and (I) TNFα. *P ≤ 0.05 and ***P ≤ 0.001.

