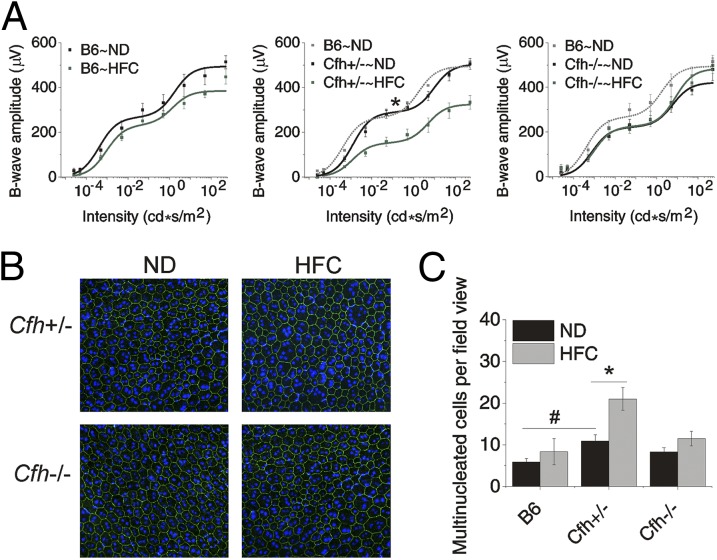
Fig. 3.
Significant vision loss and RPE damage in response to the HFC diet is only detected in Cfh+/− mice. (A) Scotopic electroretinogram (ERG) flash responses in wild-type B6, Cfh+/− and Cfh−/− mice fed a ND or HFC diet. Stimulus–response curves of b-wave amplitudes. Data are expressed as mean ± SE of the stimulus–response curve overlaid with B = (Bmax1*I/I + I1)/(Bmax2*I/I + I2) comparing ND (black) to HFC (green) with B6∼ND overlaid (gray in Cfh+/− and Cfh−/− graphs) for genotype comparisons. Cfh−/−∼ND mice were slightly worse at baseline compared with B6∼ND and Cfh+/−∼ND mice; however, this failed to reach statistical significance by ANOVA. B6 and Cfh−/− mice showed no statistically significant depression of ERG amplitude with HFC diet. Cfh+/−∼HFC mice showed a marked decrease in b-wave amplitude (middle graph). The asterisk (*) indicates post hoc Tukey for a P < 0.05 following a statistically significant genotype by diet interaction by ANOVA for the mean Bmax1 value shown in Fig. S2. n = 6–10 mice per group. (B) Representative confocal fluorescence images of flat mounts of the central RPE from >90-wk-old mice Cfh+/− and Cfh−/− mice fed a ND or HFC diet that were stained with Hoechst 33342 (blue, nuclei) and anti-ZO-1 (green) and imaged RPE apical side up with the neural retina removed. In Cfh+/−∼HFC mice, there are many more enlarged, multinucleate cells. (C) Quantification of multinucleate (nuclei, ≥3) RPE cells per field view, demonstrating that Cfh+/−∼HFC RPE flat mounts have the largest number of multinucleate cells per field view of all of the groups. Data are presented as mean ± SE. The asterisk (*) indicates post hoc Tukey for a P < 0.05 following a statistically significant genotype by diet interaction by ANOVA. The number sign (#) indicates post hoc Tukey for a P < 0.05 following a statistically significant genotype interaction by ANOVA. n = 6–8 per group.

