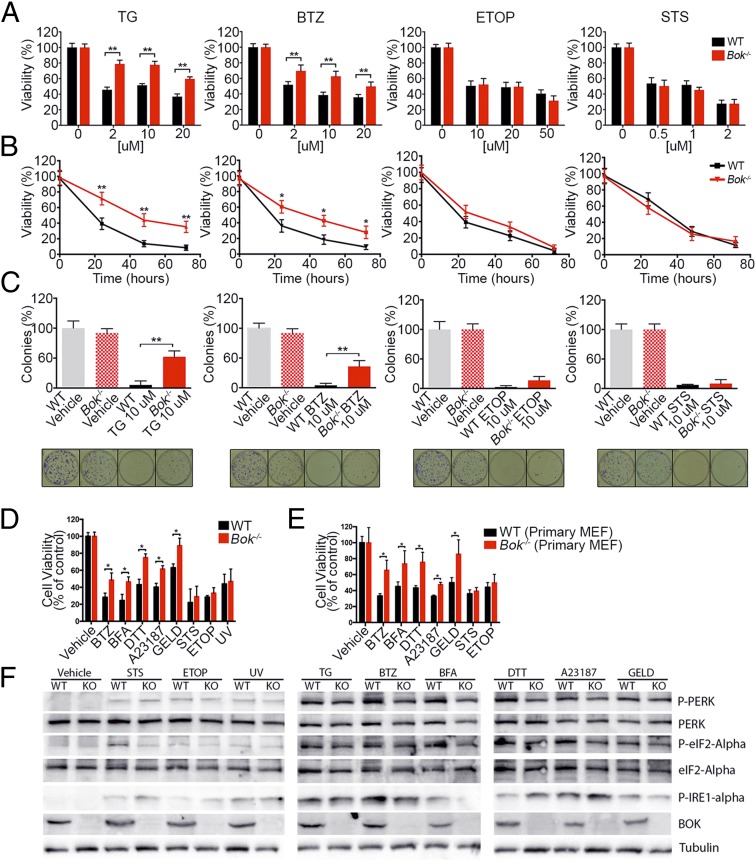
Fig. 2.
Loss of Bok protects cells from ER stress-induced death. (A and B) Cell viability of SV40-immortalized WT and Bok−/− MEFs as measured by the XTT assay at 24 h using the indicated concentrations of thapsigargin (TG), bortezomib (BTZ), etoposide (ETOP), or staurosporine (STS) (A) and at multiple time points with 10 μM TG, 10 μM BTZ, 10 μM ETOP, or 1 μM STS (B). Bars and lines represent percent cell viability with respect to untreated cells. (C) Number of colonies formed when SV40-immortalized WT and Bok−/− cells were plated at clonal densities after 48 h of treatment with 10 μM TG, 10 μM BTZ, 10 μM ETOP, or 1 μM STS, as compared to untreated cells. Representative wells are shown below. (D and E) Cell viability was measured at 24 h by XTT of SV40-immortalized MEFs (D) and primary WT and Bok−/− MEFs (n = 5) (E) at 1 μM BTZ, 2 μM brefeldin A (BFA), 1 μM DTT, 2 μM A23187, 1 μM geldanamycin (GELD), 1 μM STS, 1 μM ETOP, and after 5 min of 100 J/m2 UV (UV light; SV40-immortalized MEFs only). All experiments were performed at least in triplicate. Error bars represent SD. Significance was calculated using an ANOVA test (*P < 0.05, **P < 0.005). (F) Representative Western blot analysis for ER stress response pathway in WT and Bok−/− (KO) MEFs 6 h after treatment with vehicle, 1 μM STS, 1 μM ETOP, 5 min of 100 J/m2 UV, 2 μM TG, 1 μM BTZ, 2 μM BFA, 1 μM DTT, 2 μM A23187, and 1 μM GELD.

