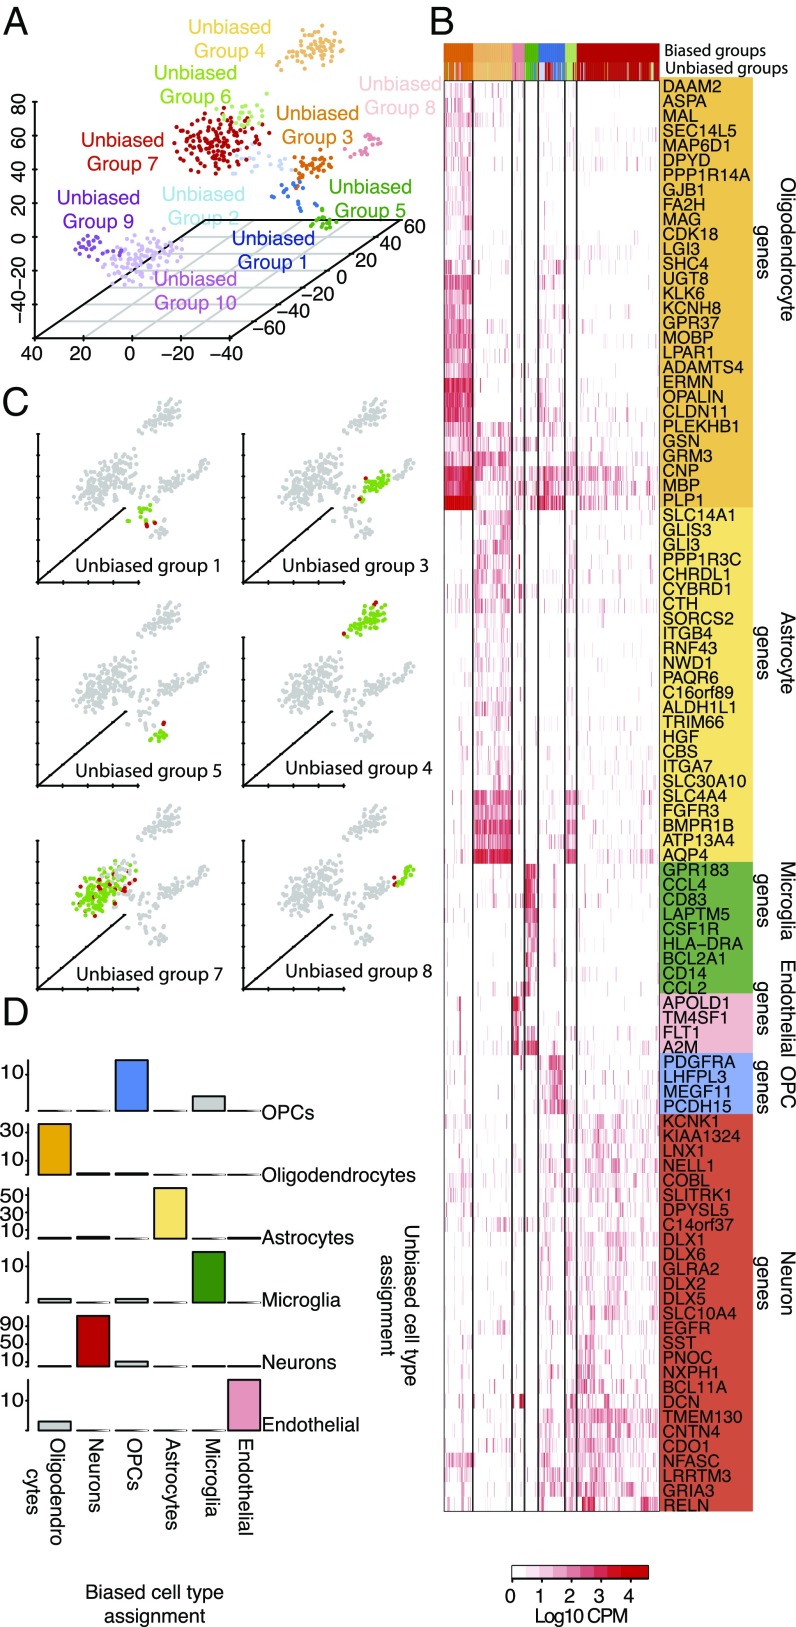
Fig. 1.
(A) Single cells colored by cluster on a 3D space. Ten clusters were identified. (B) Hierarchical clustering of all adult brain cells using a subset of cell-type–enriched genes. Biased groups are groups of cells resulting from the hierarchical clustering, whereas unbiased groups are groups of cells as defined using an unbiased approach. (C) A 3D representation of all cells using the unbiased approach. For each of the unbiased groups of cells belonging to a major cell type, the agreement with the biased groups is shown, with cells classified as members of a particular cell type by both approaches colored in green and cells differentially classified shown in red. (D) Agreement between the biased and unbiased cell-type assignments for each cell type. Number of cells is shown on the y axis.

