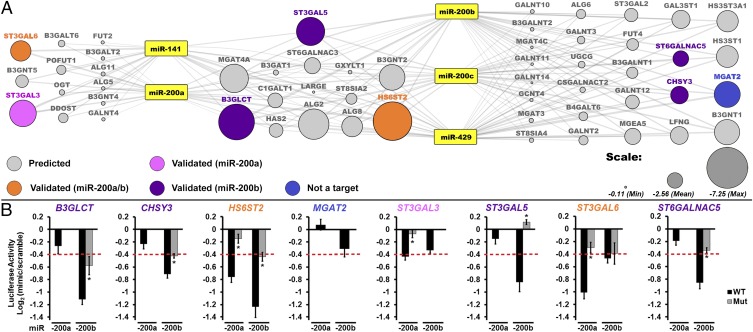
Fig. 1.
A broad network of glycogenes is targeted by miR-200f. (A) Network of predicted glycogene targets for miR-200f. Gray lines connect miRNA to predicted glycogene targets (circles). The size of the circle reflects combined miRSVR scores for all miR-200f predictions. Targets tested by luciferase assay are colored-coded as shown in the key in the figure. (B) Graphical representation of luciferase data. Luciferase–3′-UTR reporter constructs were cotransfected with miRNA or scramble mimics (60 nM) in HEK 293T/17 cells. Luciferase signal was assayed 24 h posttransfection. The graphs display average log2 (mimic/scramble). n = 3 biological replicates; *P < 0.005, t test. For wild-type constructs (black bars) displaying a ≥25% decrease (red line), mutants of the appropriate binding region were tested (gray bars; see Table S2). Fig. S1 shows the effect of all five miR-200f members on select constructs. Error bars represent the SD.

