Fig. 2.
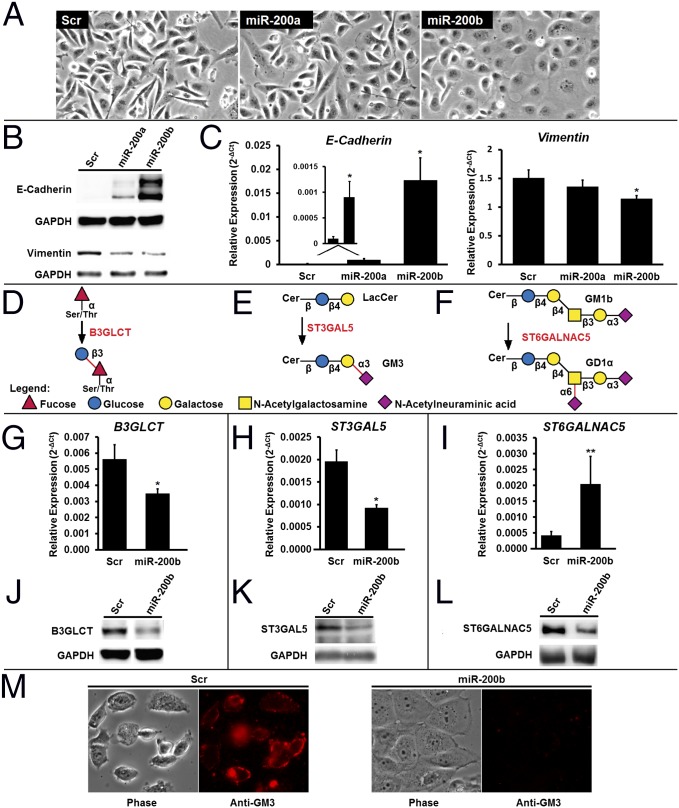
MiR-200f regulates glycosylation in MDA-MB-231 cells undergoing MET. (A) Representative phase-contrast images of MDA-MB-231 cells treated with scramble, miR-200a, or miR -200b mimics (50 nM, 7 d). The morphology is consistent with the induction of MET by miRNA. (B) Western blot analysis of the EMT markers E-cadherin (epithelial) and vimentin (mesenchymal) from MDA-MB-231 cells treated as in A. Data shown are representative of four biological replicates. (C) Relative abundance of mRNA for the EMT markers E-cadherin and vimentin from MDA-MB-231 cells treated as in A. qRT-PCR data are reported as the average of the relative expression in four biological replicates normalized to GAPDH. Error bars denote SD; *P < 0.005, t test. (D–F) Glycan epitopes biosynthesized by B3GLCT (D), ST3GAL5 (E), and ST6GALNAC5 (F). (G–I) Relative abundance of mRNA encoding B3GLCT, ST3GAL5, and ST6GALNAC5 shows changes in transcript expression with MET. Analysis was on samples from C using the same methods. n = 4; *P < 0.005; **P < 0.02, t test. (J–L) Western blot analysis shows a decrease in B3GLCT (J), ST3GAL5 (K), and ST6GALNAC5 (L) protein levels with MET. Samples from B were used. Representative images from four biological replicates are shown. (M) MDA-MB-231 cells undergoing MET lose GM3. MDA-MB-231 cells were treated as in A, fixed with paraformaldehyde, and stained for GM3 (see SI Experimental Procedures for details). Phase-contrast and fluorescence images representative of two biological replicates (four images per replicate) are shown. Scr, scramble.

