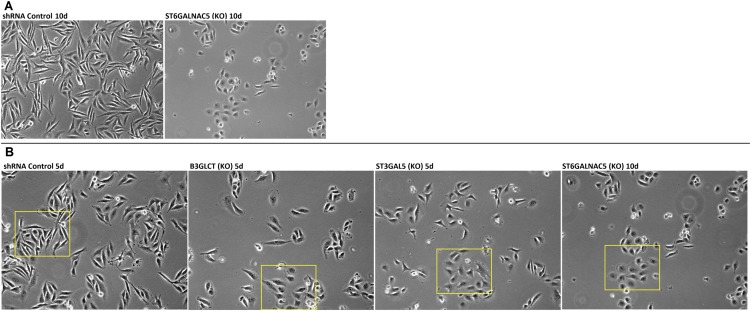
Fig. S4.
Effect of glycogene silencing on MDA-MB-231 morphology. (A) Representative phase-contrast images of MDA-MB-231 cells treated with control or shRNA against ST6GALNAC5 on day 10 posttreatment. (B) Original uncropped images corresponding to those shown in Fig. 3A. Yellow boxes indicate regions selected for Fig. 3A.

