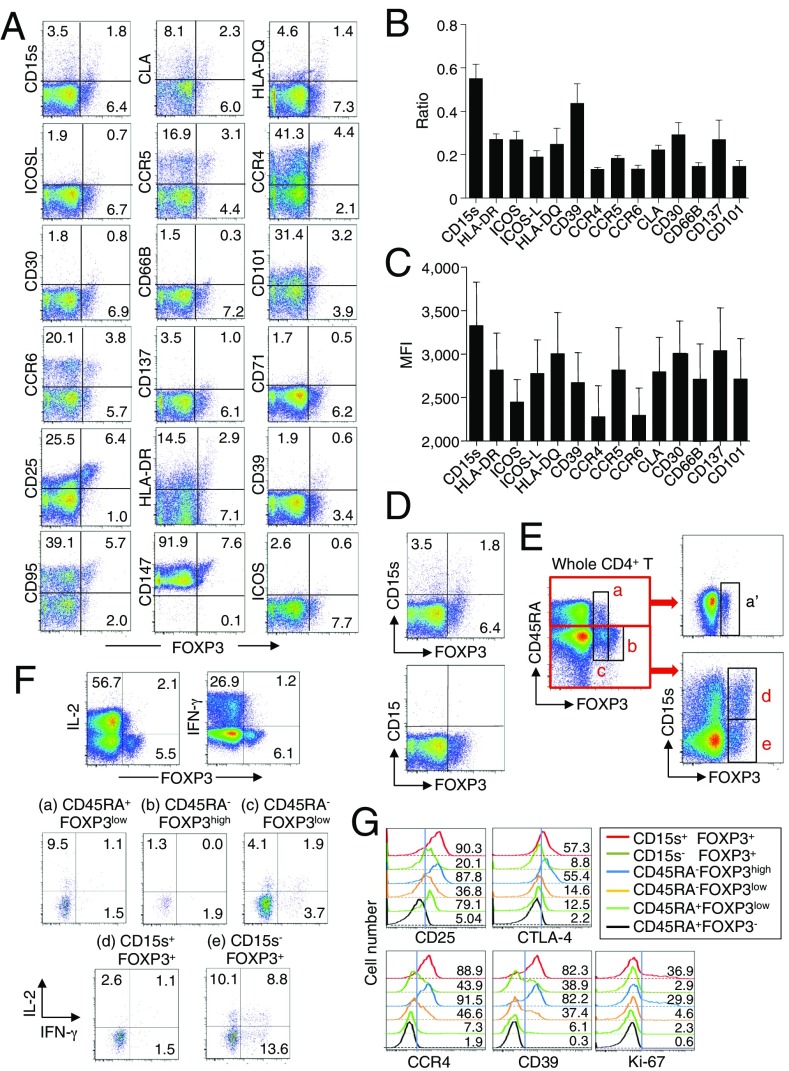
Fig. 1.
Cell surface markers for FOXP3+CD4+ T-cell subpopulations. (A) Expression of intracellular FOXP3 and each indicated surface marker by CD4+ T cells in a healthy donor. (B) Ratios obtained as the proportion of marker+ FOXP3+ cells among CD4+ T cells divided by the proportion of marker+FOXP3− cells among CD4+ T cells. (C) MFI of FOXP3 expression by marker+FOXP3+ cells. (D) CD4+ T-cell expression of FOXP3 and CD15s or CD15. (E) FOXP3+ subpopulations (a–c) depicted by staining of CD4+ T cells for FOXP3 and CD45RA expression were further divided into three populations (a′, d, and e) by the level of CD15s expression. A–E are representative of six independent experiments. (F) IL-2 and IFN-γ production in CD4+ T cells (Top) and gated CD4+ T-cell subsets as defined in E, after stimulation with PMA and ionomycin for 5 h. Percentages of cytokine-secreting cells are shown. (G) Analysis of CD25, intracellular CTLA-4, CCR4, CD39, and Ki-67 expression by indicated populations. F and G are representative of three independent experiments.

