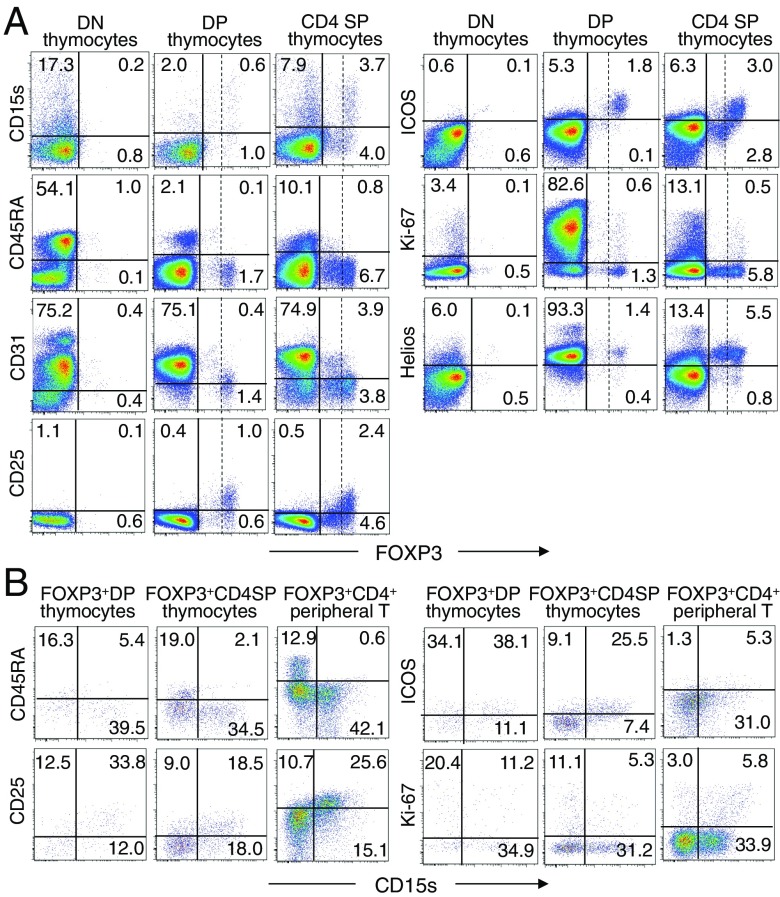
Fig. 3.
CD15s expression by FOXP3-expressing thymocytes. (A) Flow cytometry analysis of FOXP3 and the indicated markers by DN, DP, and CD4 SP thymocytes. Vertical dashed lines separate FOXP3+ cells into FOXP3high and FOXP3low cells. (B) Expression of CD15s and indicated markers by FOXP3-expressing DP or CD4 SP thymocytes and peripheral FOXP3+CD4+ T cells. Data are representative of three independent experiments.

