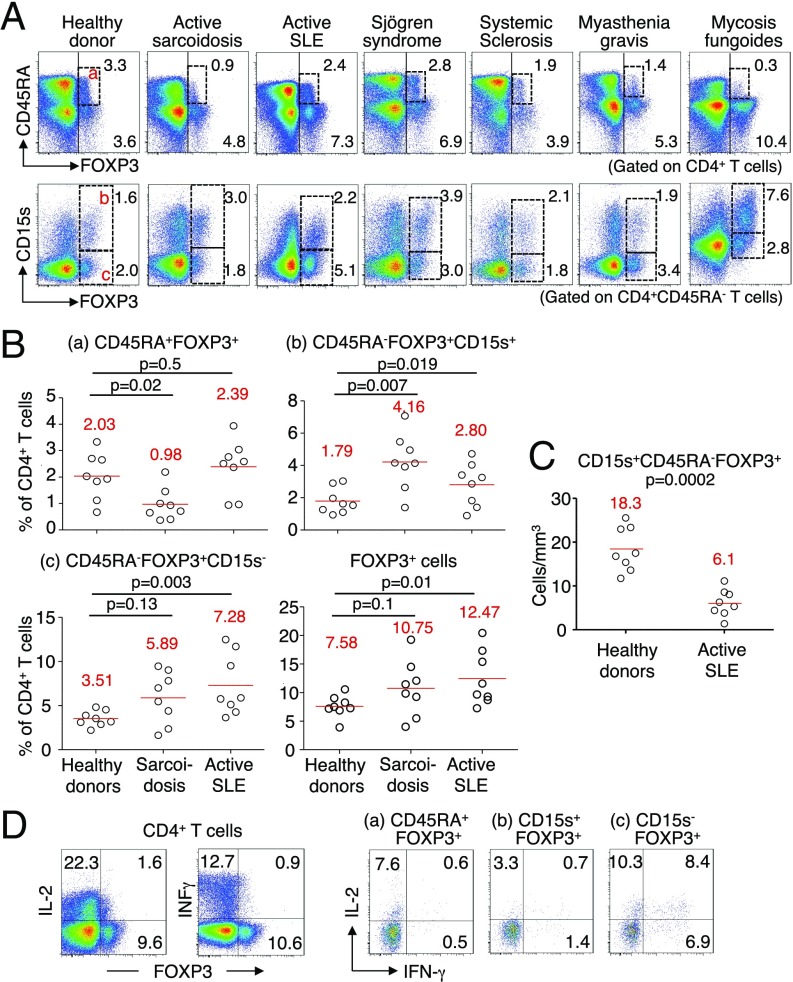
Fig. 5.
CD15s+ eTreg cells in patients with immunological diseases. (A) Flow cytometry analysis of PBMCs gated on CD4+ T cells of a representative healthy donor and of patients with active sarcoidosis, active SLE, Sjögren syndrome, systemic sclerosis, myasthenia gravis, or untreated mycosis fungoides. Expression of CD45RA and FOXP3 on whole CD4+ T cells (Top) and of CD15s and FOXP3 on CD45RA−CD4+ T cells (Bottom). Numbers indicate percentage of respective populations among whole CD4+ T cells. (B) Proportions of FOXP3+ subsets among CD4+ T cells in eight healthy donors, eight patients with active sarcoidosis, and eight patients with active SLE. Mean values are in red. For comparisons and to establish statistical significance, a nonparametric Mann–Whitney u test was performed with P < 0.05 as significant. (C) Absolute counts of CD15s+ eTreg cells in eight healthy donors and the eight active SLE patients shown in B are compared using a nonparametric Mann–Whitney u test. Mean values are shown in red with P < 0.05 as significant. (D) Flow cytometry of the production of IL-2 and IFN-γ by CD4+ T cells from an active SLE patient and FOXP3+ subpopulations gated as shown after stimulation with PMA and ionomycin for 5 h. Percentages of cytokine-secreting cells are shown. Data are representative of three independent experiments.

