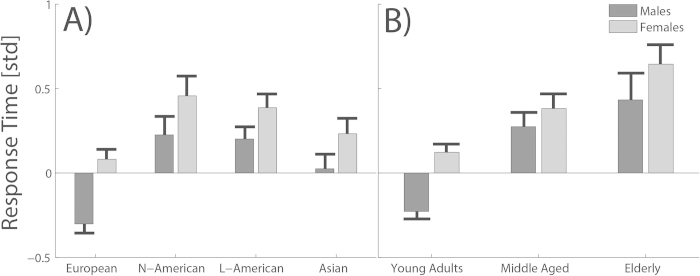
Figure 1. Reaction times for the different subgroup populations.
The y-axis shows the mean reaction time in normalized standard deviations. The x-axis separates the different subgroups. Panel A shows the reaction times for the different cultural groups, subdivided into males (dark grey bars) and females (light grey bars). Panel B shows the reaction times for the three different age groups again separated by the gender factor. The error bars illustrate the standard error of the mean.

