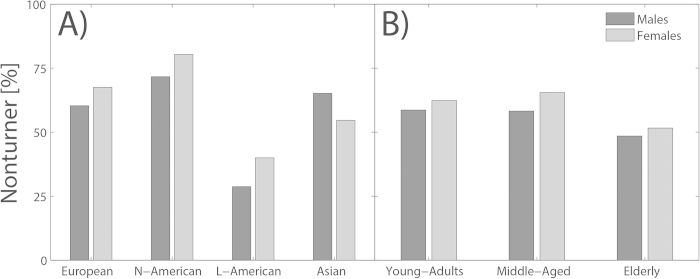
Figure 3. Reference frame proclivities of the subgroup populations.
The y-axis shows the percent of Nonturners (compared to Turnesr) for a given subgroup. The x-axis separates the subgroups by their cultural background (Panel A) and age (Panel B). The data is again subdivided between males (dark grey bars) and females (light grey bars). The height of the bars illustrates the relative amount of Nonturners in the respective subgroup.

