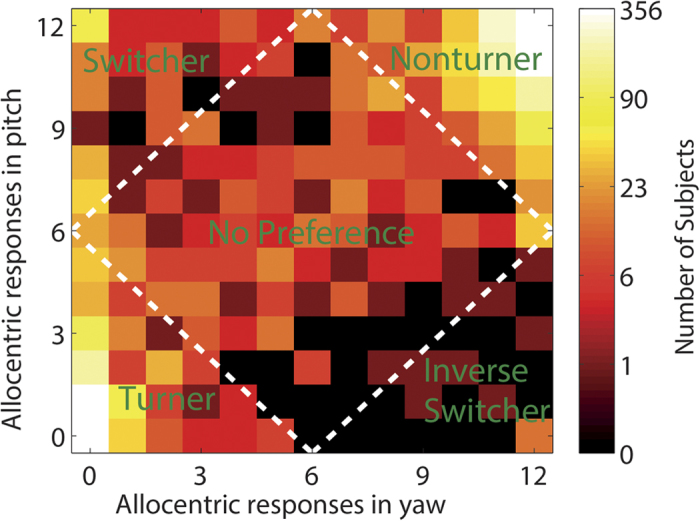
Figure 5. Classification of all subjects into reference frame strategy groups.

The y-axis indicates the number of allocentric responses in pitch, the x-axes indicates the number of allocentric responses in yaw. The color of the squares reflects the number of subjects with identical ratios of allocentric vs. egocentric responses for both yaw and pitch (bright yellow indicates many subjects; dark brown indicate few subjects). The logarithmic scale to the right shows the number of subjects corresponding to each color, with rounded values. The white, dashed line marks the boundaries between the reference frame strategy groups. Additionally, the labels (in green) indicate the names of the respective strategy groups.
