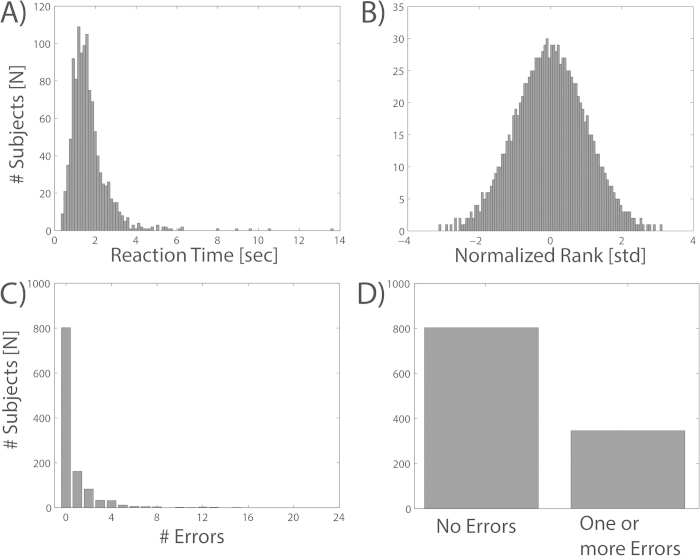
Figure 6. Distribution properties of the performance measures.
Panel A shows the distribution of median reaction times for all of the participants. Panel B illustrates the distribution of reaction times after a normalized rank transformation. Panel C shows the histogram of errors for all of the participants. Panel D illustrates the distribution of participants into the two error groups (no errors, one or more errors).

