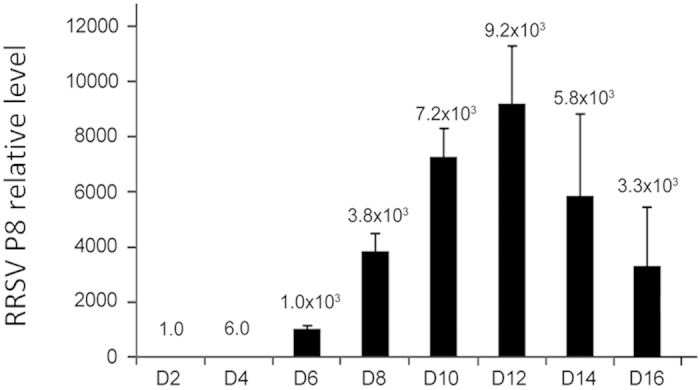
Figure 1. Relative quantification analysis of RRSV P8 transcript levels in the salivary glands of N. lugens.

Total RNA was extracted from salivary glands at the indicated times following RRSV infection and subjected to quantitative real-time PCR analysis using a pair of primers to specifically amplify the RRSV major capsid protein gene, P8. The relative P8 transcript levels were calculated using N. lugens 18S rRNA as an internal control. A mixture of 100 salivary glands was used as one biological sample due to the very low quantity of salivary glands. Samples from each time point were tested in three biological replicates, and the mean value used to analyze the relative transcript levels.
