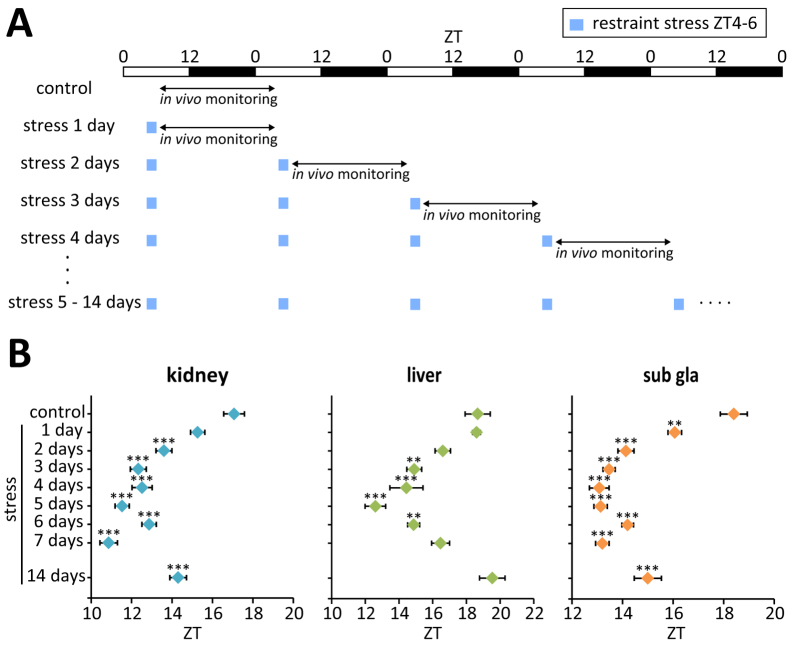
Figure 2. Long-term effects of restraint stress at ZT4–6 on peripheral PER2::LUC oscillations.
(A) Experimental schedule. (B) Peak phases of peripheral PER2::LUC oscillations on each day. The number of tissues that met the criteria for rhythmicity is shown in Table S1. Values are expressed as mean ± SEM. **P < 0.01, ***P < 0.001 vs. control (one-way ANOVA with Dunnett post-hoc test).

